Download
1 / 5
50 likes | 209 Views
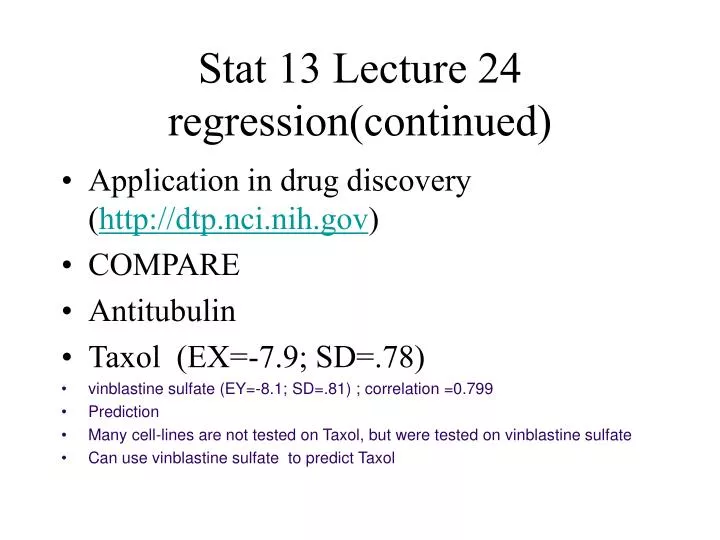
Stat 13 Lecture 24 regression(continued). Application in drug discovery ( http://dtp.nci.nih.gov ) COMPARE Antitubulin Taxol (EX=-7.9; SD=.78) vinblastine sulfate (EY=-8.1; SD=.81) ; correlation =0.799 Prediction

E N D
Stat 13 Lecture 24 regression(continued) • Application in drug discovery (http://dtp.nci.nih.gov) • COMPARE • Antitubulin • Taxol (EX=-7.9; SD=.78) • vinblastine sulfate (EY=-8.1; SD=.81) ; correlation =0.799 • Prediction • Many cell-lines are not tested on Taxol, but were tested on vinblastine sulfate • Can use vinblastine sulfate to predict Taxol
Taxol=-7.9 + .799(7.8/8.1)(vinblastine sulfate +8.1) • Malanoma UABMEL3 -7.9 (vinblastine sulfate) • No taxol data • Predicted Taxol = -7.9 + .799(7.8/8.1)(-7.9+8.1) • = -7.75
Vertical axis: vinblastine sulfate Cannot use this line to predict Taxol from vinblastine sulfate; Redraw the graph by exchanging X and Y
Percentile rank problem : Suppose only the ranking of x is given. Predict the ranking for y. The trick is to pretend X and Y both have mean 0 and standard deviation 1 The reason you can do so is because ranking does not change under scale changes ++++++++++++++++++++++++++++=vinblastine sulfate Step 1 convert the rank to x by using normal table Step 2 find y by using y = r x Step 3 convert y back to percentile rank using normal table again.