Download
1 / 25
250 likes | 259 Views
Improvement Model and PDSA Cycles. The Service Improvement Model provides a framework to test, implement and sustain change ideas to overcome barriers to donation. Organ Donation. Overview. Understand the problem and its causes. Define aim and measures. Collect change ideas.

E N D
The Service Improvement Model provides a framework to test, implement and sustain change ideas to overcome barriers to donation Organ Donation
Overview Understand the problem and its causes Define aim and measures Collect change ideas Test change idea with PDSA cycles Implement changes that are improvements Work with colleagues and value different perspectives Link frontline changes with strategic objectives Work towards sustainability as part of implementation
Stakeholder analysis Process Mapping Root Cause Analysis Ishikawa Fishbone Gathering data - quantitative data - qualitative data Tools for defining problem “If I had one hour to save the world, I would spend 59 minutes defining the problem and one minute finding a solution.” Albert Einstein
Identify as many stakeholders as possible Understand the different roles along the donation pathway Enables appropriate use of resources Decide how people will be engaged Stakeholder analysis
Visual representation of the organ donation pathway Identify key stages of the pathway and who is involved Avoids only one person’s perspective Understand viewpoints and experiences of clinical colleagues and families Identify opportunities to improve organ donation Why process map
Work with key stakeholders as a group Define the scope (start and end of the process) Start with a high level map Proceed with a more detailed analysis once key problems identified Describes what really happens How to map a process
Exclude reversible causes Brain Injury Meets clinical criteria Appropriatepersonnel Approach Family Brain death testing Perform Ancillary tests Stabilise physiology Detailed Process Map Brain Death Testing
Repeating the question ‘why’? can lead to the cause of a problem to be identified As a simple guide the question ‘why’? Should be asked at least 5 times By identifying the cause of a problem interventions can be developed to prevent reoccurrence Resources can be focussed to the correct area of a problem Root Cause Analysis
Useful for complex problems with multiple causes Group exercise Brain storm possible causes Root cause analysisFishbone diagrams
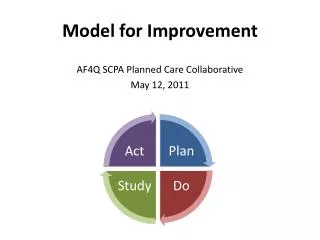
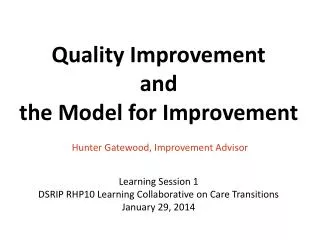
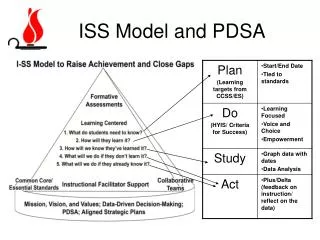
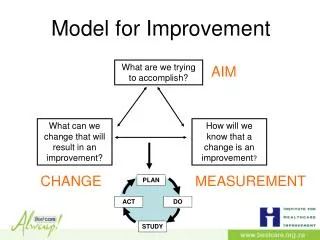
Define your measures Collect baseline data before implementing change Make changes on a small scale and ensure it is modifiable, measurable and realistic. May require multiple cycles Can deliver rapid service improvement What are we trying to achieve? How will we know that change is an improvement? What changes can we make that will result in improvement? act act plan plan study study do do The Model for Improvement
What are we trying to achieve? Model for Improvement The PDSA cycle is a controlled test of a change idea that should provide a quick assessment of whether the idea will be effective or not. Remember that a change idea is being tested, that not all will work and some might make things worse. How will we know that change is an improvement? What changes can we make that will result in improvement?
Plan: we will do this, in this location, with this expectation Do: we did this, we made these measurements and observed these unexpected occurrences Study: our data from the pilot compare with baseline data in this way. We also had the following problems Act: as a result of our observations we will now extend the trial, adjust the change idea, trial more widely, implement into practice etc What are we trying to achieve? Model for Improvement How will we know that change is an improvement? What changes can we make that will result in improvement?
Agree how the data will be collected Agree how the data will be analysed and presented Keep it simple Data Collection
Don’t think too big make it manageable and realistic, break down big changes into smaller interventions Don’t be too vague need some detail, although to a practical, not obsessive, level Measure and monitor impact of change qualitative data is important, but best if complemented by quantitative In practice more than 1 PDSA can be run at a time as long as they are small and simple Tips
Minimum of 3 levels - Strategic aim - Primary drivers what is causing the problem - Intervention or change idea being tested against each of the primary drivers Links specific interventions to overall aim Achieving strategic objectivesDriver diagrams
Define the strategic goal (vision or strategic objective). Gather together a group of people who know about the subject Generate ideas to identify the key things which need to be improved to achieve the outcome Cluster the ideas to see if groups represent a common driver Generate the interventions (change ideas) linked to each of the drivers Steps to develop driver diagrams
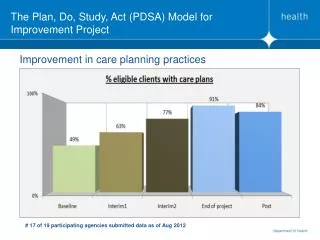
Consider during the implementation plan of how the change can be sustained. When a change idea is tested and led to an improvement then it should be considered for adoption into practice The most important factor when considering sustainability is staff engagement and effective leadership Measurement is vital to demonstrate sustainability Implementation and Sustainability
What were we trying to achieve? Increased consent rates by increasing SN-OD involvement How would we know the change was an improvement?Measure consent rates and SN-OD involvement rates in Phase 2 data collection of ACCORD, alongside UK PDA What changes could we make that would result in improvement? Improve nursing staff attitudes towards SN-OD involvement, peer review consultant performance against this metric, clear protocol for all clinical staff to follow explaining how families should be approached with evidence UK Example
Develop Mandatory Study Day Peer review consultant performance Development of Organ Donation Care Pathway by CLOD & SNOD – all unit staff consulted, document piloted for 6 months and feedback invited UK Example
Phase 1 problem identified - consent rate (54%) collaborative approach 46% Phase 2 significant improvement – consent rate (76%) Phase 2 consent rate when SNOD involved 79% UK Example