Download
1 / 51
510 likes | 759 Views
Modelling Society Energy Environment systems modelling. Mark Barrett Mark.Barrett@ucl.ac.uk UCL Energy Institute. Modelling: Contents. What are models for? What is a model? Modelling process Examples and discussion. What are models for?. To understand and teach

E N D
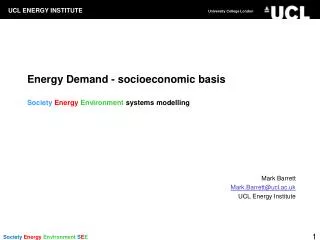
ModellingSocietyEnergy Environment systems modelling Mark Barrett Mark.Barrett@ucl.ac.uk UCL Energy Institute
Modelling: Contents • What are models for? • What is a model? • Modelling process • Examples and discussion
What are models for? • To understand and teach • Building a model to reflect some aspects of reality • To identify future problems • When will fossil reserves become scarce and expensive? • To develop policies • How do we reduce carbon emissions at least cost? • For political argument • Who is funding and doing the modelling? • What are their objectives? • How does the funder’s agenda affect: • what is included in and excluded from the model? • the exogenous inputs to the model? • the model outputs and their presentation?
The society, energy, environment system People in society have energy service demands that are met by energy systems which cause primary inputs to the environment. These inputs are modified and transported via media to impact on biota.
The energy system: demand and supply options Energy demands and sources can be linked in many ways. The appropriate linkage depends on a complex of their distribution in space and time, and the economics of the technologies used.
What is a model? • Must at least include a mathematical representation of a physical system (social and/or technological) bounded in space and time • Past state and Internal relationships based on historical data • Exogenous data inputs: • Initial system state based on historical data • Future values from system environment • Domains of model • Physical variables only • Behavioural: social, economic • Some types and methods of modelling • Dynamic and static • Simulation: with differential equations • Statistical: Monte Carlo • Optimisation: linear /non linear programming, genetic algorithms, etc. • Models are a form of human knowledge, and are incomplete and inaccurate, as any other form of knowledge about the physical world.
The modelling process • What is the question? What is the curiosity? • Collation of information about the world • Processes – how do things work? • Historical state of the system being modelled and exogenous factors • Build a model • Structure data • What software and hardware environment will be used? • Write programme to • input data • emulate processes, simulate, optimise • output data • Validate the model • Does the model reflect reality as described by historical data? • Practicalities • Money? • Who will build model? • Who will run it?
Model and data implementation Model Any Turing machine will do! • Any programmable system: Excel/VBA, FORTRAN, Matlab, Python, C……. • Some higher level packages built on programming language: GAMS, optimizers, simulators • To run in environments: Windows, Mac, Unix…. • Models previously developed: EnergyPlus, TAS, MARKAL… Choice depends on: • Questions, needs • Users’ and developers’ knowledge • Software and systems of users • Special requirements; speed, packages, graphics etc. Data Most computer languages have routines to read and write to databases • Small dbs: Excel etc. • Large dbs: Access, SQL
The energy service chain SERVICE CHAIN • Energy required to make and operate service delivery system. • Services and supplies have spatiotemporal distributions (some weather dependent) • Storage improves security A given energy system has a configuration of these principal components: • Demands (D): heating, lighting, transport, etc. • Converters (C): convert energy in one form and place to another • Artificial stores (A): heat, work • Natural stores (N): heat, work And it operates in an environment • Environment (V)
Data: endogenous Essential to have historical data on: • the flows through the system and its state • the stocks and features of the SEE system at some historical point • how the environment, people and technologies behave These data are used to: • assess the accuracy of a model (it has to at least emulate the past) • provide a base line or starting point for modifying the system Collating and updating databases is hard. Most data at least 3 years old. Flows and state • Energy – flows and storage of different forms at different points in the system • Emission • Money Stocks: Numbers and types of • people • technologies Behaviour • How system components behave according to physical and social factors
Data: exogenous All models address a restricted part of the world in terms of: • system components and processes • space • time Elements of the world that affect the system modelled, but are not included in the model, need to be accounted for, these require exogenous assumptions. These assumptions may be based on extrapolations of historical data by judgement, or other models, for example: Dwelling model: tenants, behaviour City model: city population, commuting, commercial activities Electricity model: fuel prices and availability, import potential National forecasting model: population, international fuel prices, energy trade
DYNAMICS – WHAT AND WHY • Long term dynamics – changes to capital stocks (buildings, power stations, etc.) in scenarios transforming whole energy system • Short term dynamics - demand-supply matching over minutes to months 1 and 2 required for optimisation of system design. • 2 required: • to ensure system is technically feasible e.g. mix of renewables and dispatchable generators works; • to explore potential of fast measures such as load management and spatiotemporal controls in buildings • to do accurate costing and estimation of emissions, environment and health impacts, etc.
Time dynamics: years • SEE systems evolve over the years in terms of stocks of components and configuration. Demography: People, households Technologies: dwellings, cars, power stations • The rate at which systems can change depends largely on the rates of additions and subtractions from stocks • The rate of stock change is a strong determinant of how fast policies can take effect S(t+1) = S(t) + A(t) – S(t) Subtractions depend on assumed lifetime and age structure of stock. A unit may be subtracted deterministically (after a fixed number of years) or according to a probability distribution (e.g. for people dying). Additions depend on change in total stock requirements and subtractions. These stock elements (people, technologies) have ‘typical’ historic lifetimes, but these may be changed through policies. For example, old polluting cars or power stations might be phased out quickly with tax or subsidy.
Stock dynamics; years - examples People Ships Dwellings Appliances
Time dynamics: operation Given a configured system of stocks, the simulation model then generally calculates energy flows between system components over some time step (minutes, hours, days) In general the operation of components is a complex function of many factors. D(t) = f(people, time, environment, technology) Energy in = Energy out / Converter efficiency Ein(t) = Eout(t) / Ceff(t) where converter efficiency is a variable function Ceff(t) = f(environment, load, etc.) Artificial storage level = previous level + energy out – energy out A(t+1) = A(t) + Ein(t) - Eout(t) Natural storage level = previous level + energy out – energy out N(t+1) = N(t) - Eout(t)
Building dynamics Wait for animation to run • Weather and • Occupancy, over hours and months, drive: • ventilation • energy flows • pollution • personal exposure
The Physical Environment http://sunbird.jrc.it/pvgis/pv/animations/images/global_anim66.gif
Daily weather and fuel consumption: wks 1/2 Data for Milton Keynes 5 bed 4 occupant house provided by Alex Summerfield
Ethics: equal CO2 emission per person? Humans have equal rights to emissions, therefore convergence of emission per person in the EU and elsewhere? What about different resources and climate of countries? Note that for global equity, EU per capita emissions will have to fall by over 95% to reach 60% reduction globally.
OBJECTIVES OF STRATEGY SOCIAL, ECONOMIC, POLITICAL • Meet objectives at least cost with social equity • Avoid irreversible, risky technologies ENERGY SECURITY • Reduce dependence on finite fossil and nuclear fuels • UK 20% of energy from renewables by 2020 => ~35% renewable electricity? • renewable transport fuels: 5% of by 2010, 10% by 2020 ENVIRONMENT UK • Government targets for GHG reduction from 1990: 12-20% by 2010, ~30% by 2020, 60-80% 1990-2050, including international transport. • Require >95% GHG reduction for climate control and global equity Europe • 20/30% GHG reduction 1990-2020
Policy measures: physical measures and rate of change Size of effect, rate of effect and cost
Objectives To develop strategy to meet air quality standards across EU at least cost Focus on air quality standards in 2010, but period to 2020 to be considered Strategy least cost, but also practicable in wider economic, social and political terms Strategy consistent with other environmental objectives Scope Pollutants - NOx, CO, VOCs, PM, benzene, ozone, (SO2, CO2) All 15 EU countries Pollution emission from transport and stationary sectors to be considered All emission control instruments and measures for transport to be considered Auto-Oil programmes: objectives and scope
Possible objectives, constraints and implications A. Minimise the Present Value of abatement costs so as to meet physical environmental targets (Objective used in Auto-Oil programmes 1 and 2) • Ensures environmental targets will be met • Gives no value to overshoot of targets • Does not require impact weighting B. Minimise Discounted Cost/Impact ratio (whilst meeting physical environmental targets?) • Ensures environmental targets will be met • Gives more weight to short term impact reduction • Requires impact weighting C. Minimise the Net Present Value of costs due to damage and those due to abatement • This is a CBA and requires an assessment of the benefits of reducing environmental impacts • Requires a full analysis of the social costs of pollution • Will give more weight to short term costs • Does not guarantee that physical environmental targets will be met, may lead to over or under ‘achievement’ • Does not require impact weighting
Outdoor pollution concentration Outdoor pollution concentrations vary spatiotemporally, and so affect exposure and indoor concentrations. Graphs illustrate emissions and concentrations at different times across a city cross-section. 3 am 6 pm
Technical basis: SEEScen: Society, Energy, Environment Scenario model SEEScen is applicable to any large country having IEA energy statistics SEEScen calculates energy flows in the demand and supply sectors, and the microeconomic costs of demand management and energy conversion technologies and fuels SEEScen is a national energy model that does not address detailed issues in any demand or supply sector. Method • Simulates system over years, or hours given assumptions about the four classes of policy option • Optimisation under development
Stock model • Purpose: calculate energy, carbon, costs (+health) of population in built stocks for scenarios • Inputs: • Demography and use patterns • Building stocks, appliances • Energy efficiency and supply programmes • Outputs: • Energy (annual, hourly) • Costs • (Labour, material requirements…) • Methods • Simulation of individual occupant/building combinations and changing populations • Optimisation?
Stock model - parameters • What combinations of social, building and weather parameters to model with individual building and stock models? Depends on questions! Number of possible combinations is astronomic. • Social: • Household type, activity, appliances, wealth, ownership/tenure… • Building: • Built form and size • Fabric and ventilation including efficiency measures • Energy systems and controls • Weather: • Historic and projected weather and pollution datasets (location, years?)
UK dwellings scenario illustration: database 1 Efficiency packages taken from individual building optimization? Summary characteristics of building: • Areas envelope, % external • U-values • Cost of elements
UK dwellings scenario : database 2 Other characteristics of building: • Specific loss • Space heat load • Other demands • Embedded energy and carbon • Capital costs
UK dwellings scenario (illustration) Stock projection Slow demolition rate, so refurbish. Cohort space heat loss Space heat in 2050 dominated by current buildings
AviAn – aircraft model • Aircraft technically much more complex in terms of energy consumption and altitude effects