Download
1 / 4

E N D
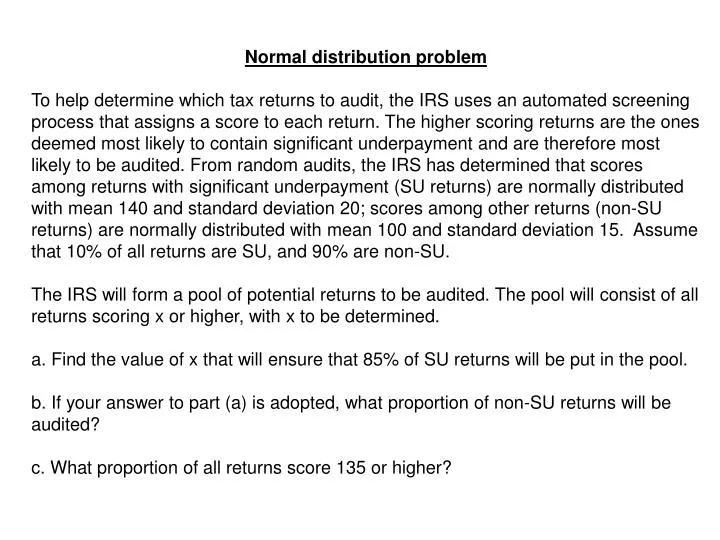
Normal distribution problem To help determine which tax returns to audit, the IRS uses an automated screening process that assigns a score to each return. The higher scoring returns are the ones deemed most likely to contain significant underpayment and are therefore most likely to be audited. From random audits, the IRS has determined that scores among returns with significant underpayment (SU returns) are normally distributed with mean 140 and standard deviation 20; scores among other returns (non-SU returns) are normally distributed with mean 100 and standard deviation 15. Assume that 10% of all returns are SU, and 90% are non-SU. The IRS will form a pool of potential returns to be audited. The pool will consist of all returns scoring x or higher, with x to be determined. a. Find the value of x that will ensure that 85% of SU returns will be put in the pool. b. If your answer to part (a) is adopted, what proportion of non-SU returns will be audited? c. What proportion of all returns score 135 or higher?
Find the value of x that will ensure that 85% of SU returns will be put in the pool. We’d like to put 85% of the tax returns with significant underpayment in the pool to audit. Since higher scores mean higher chance of there being a significant underpayment, we should pick the top 85% under the SU distribution. This means 15% area will be in the left tail, giving us a Z=-1.04. X= m + Zs X = 140 - 1.04*20 119.2 Thus, we should put all returns with a score of 119.2 or higher in the pool to ensure that 85% of the SU group will be in the pool.
What proportion of non-SU returns will be audited? To answer this, we need to calculate area under the Non-SU curve that exceeds 119.2 Z = (x-m)/s (119.2 – 100)/15 Z = 1.28 Area to the right of 1.28 is 10% Thus, 10% of Non-SU returns will be put in the pool.
What proportion of all returns score 135 or higher? This answer has 2 parts: Part 1 – determine the proportion of scores under the Non-SU and SU curves that exceed 135. Proportion of returns over 135 in the SU group Z = (x-m)/s (135 – 140)/20 Z = -0.25 Area to the right of -0.25 is about 60% Thus, 60% of SU returns will be greater than 135. Proportion of returns over 135 in the non-SU group Z = (x-m)/s (135 – 100)/15 Z = 2.33 Area to the right of 2.33 is 1% Thus, 1% of Non-SU returns will be greater than 135. Part 2 – adjust for the percentage of non-SU and SU groups. According to the data, 10% are SU and 90% are non-SU. Thus: 60%*10* + 1%*90% 6% + .9% = 6.9% will have scores greater than 135.