Download
1 / 1
10 likes | 101 Views
Spatio -temporal clustering of human anthrax outbreaks in Azerbaijan, 1937 – 1998, using SaTScan. Rakif Abdullayev 1 , Rita Ismayilova 1 , Narmin Ustun 1 , Zaur Mahyaddinov 2 , Aydin Talib-zada 1 , Ian T. Kracalik 3 , Jason K. Blackburn 3

E N D
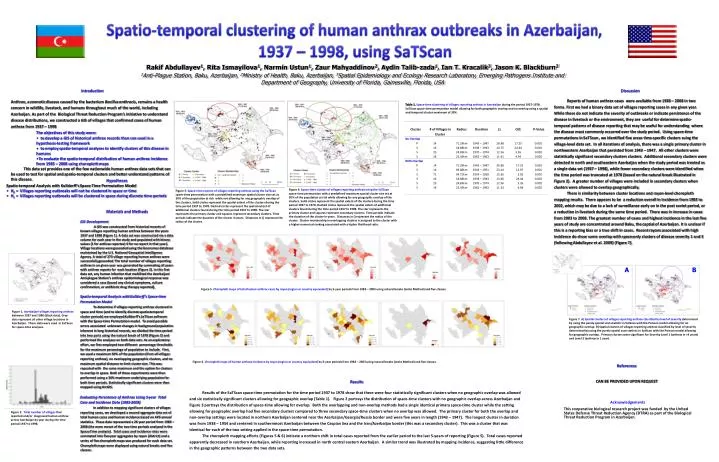
Spatio-temporal clustering of human anthrax outbreaks in Azerbaijan, 1937 – 1998, using SaTScan Rakif Abdullayev1, Rita Ismayilova1, Narmin Ustun1, Zaur Mahyaddinov2, Aydin Talib-zada1, Ian T. Kracalik3, Jason K. Blackburn3 1Anti-Plague Station, Baku, Azerbaijan, 2Ministry of Health, Baku, Azerbaijan, 3Spatial Epidemiology and Ecology Research Laboratory, Emerging Pathogens Institute and Department of Geography, University of Florida, Gainesville, Florida, USA • Introduction • Anthrax, a zoonotic disease caused by the bacterium Bacillus anthracis, remains a health concern in wildlife, livestock, and humans throughout much of the world, including Azerbaijan. As part of the Biological Threat Reduction Program’s initiative to understand disease distributions, we constructed a GIS of villages that confirmed cases of human anthrax from 1937 – 1998. • The objectives of this study were: • to develop a GIS of historical anthrax records than can used in a hypothesis-testing framework • to employ spatio-temporal analyses to identify clusters of this disease in humans • To evaluate the spatio-temporal distribution of human anthrax incidence from 1983 – 2008 using choropleth maps • This data set provides one of the few nationwide human anthrax data sets that can be used to test for spatial and spatio-temporal clusters and better understand patterns of this disease. Discussion Reports of human anthrax cases were available from 1938 – 2008 in two forms. First we had a binary data set of villages reporting cases in any given year. While these do not indicate the severity of outbreaks or indicate persistence of the disease in livestock or the environment, they are useful for determine spatio-temporal patterns of disease reporting that may be useful for understanding where the disease most commonly occurred over the study period. Using space-time permutations in SaTScan , we identified five areas time-specific clusters suing the village-level data set. In all iterations of analysis, there was a single primary cluster in northwestern Azerbaijan that persisted from 1943 – 1947. All other clusters were statistically significant secondary clusters clusters. Additional secondary clusters were detected in north and southeastern Azerbaijan when the study period was treated as a single data set (1937 – 1998), while fewer secondary clusters were identified when the time period was truncated at 1978 (based on the natural break illustrated in Figure 2). A greater number of villages were included in secondary clusters when clusters were allowed to overlap geographically. There is similarity between cluster locations and rayon-level choropleth mapping results. There appears to be a reduction overall in incidence from 1983 to 2002, which may be due to a lack of surveillance early on in the post soviet period, or a reduction in livestock during the same time period. There was in increase in cases from 2003 to 2008. The greatest number of cases and highest incidence in the last five years of study are concentrated around Baku, the captial of Azerbaijan. It is unclear if this is a reporting bias or a true shift in cases. Recent rayons associated with high incidence do show some overlap with space-only clusters of disease severity 1 and 3 (following Abdullayev et al. 2009) (Figure 7). Table 1. Space-time clustering of villages reporting anthrax in Azerbaijan during the period 1937-1978. SaTScan space-time permutation model allowing for both geographic overlap and no overlap using a spatial and temporal cluster maximum of 30%. • Hypotheses • Spatio-temporal Analysis with Kulldorff’s Space-Time Permutation Model • H0 = Villages reporting outbreaks will not be clustered in space or time • H1 = Villages reporting outbreaks will be clustered in space during discrete time periods Figure 4. Space-time clusters of villages reporting anthrax using the SaTScanspace-time permutation with a predefined maximum spatial cluster size set at 30% of the population at risk while allowing for any geographic overlap of the clusters. Solid circles represent the spatial extent of the clusters during the time period 1937 to 1978. Dashed circles represent the spatial extent of additional clusters found during the time period 1937 to 1998. The star represents the primary cluster and squares represent secondary clusters. Time periods indicate the duration of the cluster in years. Distances in () represent the radius of the cluster. Cluster membership in overlapping clusters is assigned to the cluster with a higher numerical ranking associated with a higher likelihood ratio. Figure 3. Space-time clusters of villages reporting anthrax using the SaTScanspace-time permutation with a predefined maximum spatial cluster size set at 30% of the population at risk while not allowing for any geographic overlap of the clusters. Solid circles represent the spatial extent of the clusters during the time period 1937 to 1978. Dashed circles represent the spatial extent of additional clusters found during the time period 1937 to 1998. The star represents the primary cluster and squares represent secondary clusters. Time periods indicate the duration of the cluster in years. Distances in () represent the radius of the cluster. Materials and Methods GIS Development A GIS was constructed from historical records of known villages reporting human anthrax between the years 1937 and 1998 (Figure 1). A data set was constructed via a data column for each year in the study and populated with binary values (1 for anthrax reported; 0 for no report in that year). Village locations were geocoded using the Geonames database maintained by the U.S. National Geospatial Intelligence Agency. A total of 273 village reporting human anthrax were successfully geocoded. The total number of villages reporting anthrax in an given year was generated by summating all years with anthrax reports for each location (Figure 2). In this first data set, any human infection that mobilized the Azerbaijani Anti-plague Station’s anthrax epidemiological response was considered a case (based any clinical symptoms, culture confirmation, or antibiotic drug therapy reported). Spatio-temporal Analysis with Kulldorff’s Space-time Permutation Model To determine if villages reporting anthrax clustered in space and time (and to identify discrete spatio-temporal cluster periods) we employed Kulldorff’sSaTScan software with the Space-time Permutation model. To avoid possible errors associated unknown changes in background population inherent in long historical records, we divided the time period into two parts using the natural break of 1978 (Figure 2) and performed the analyses on both data sets. As an exploratory effort, we first employed two different percentage thresholds for the maximum percentage of population to include. First, we used a maximum 50% of the population (from all villages reporting anthrax), no overlapping geographic clusters, and no maximum spatial distance to limit cluster size. This was repeated with the same maximum and the option for clusters to overlap in space. Both of these experiments were then performed using a 30% maximum underlying population for both time periods. Statistically significant clusters were then mapped using ArcGIS. Evaluating Persistence of Anthrax Using 5-year Total Case and Incidence Data (1983-2008) In addition to mapping significant clusters of villages reporting cases, we developed a second aggregate data set of total human cases and human incidence based on APS annual statistics. These data represented a 26 year period from 1983 – 2008 (the more recent of the two time periods analyzed in the Space-Time analysis). Total cases and incidence rates were summated into five-year aggregates by rayon (district) and a series of five choropleth maps was produced for each data set. Choropleth maps were displayed using natural breaks and five classes. A B Figure 5. Choropleth maps of total human anthrax cases by rayon (region or country equivalent) by 5-year periods from 1983 – 2003 using natural breaks (Jenks Method) and five classes. Figure 1. Azerbaijani villages reporting anthrax between 1937 and 1998 (black dots). Gray dots represent all other village locations in Azerbaijan. These data were used in SaTScan for space-time analyses. Figure 7. A) Spatial clusters of villages reporting anthrax classified by level of severity determined by using the purely spatial scan statistic in SatScan with the Poisson model allowing for no geographic overlap. B) Spatial clusters of villages reporting anthrax classified by level of severity determined by using the purely spatial scan statistic in SatScan with the Poisson model allowing for geographic overlap. Primary clusters were significant for Severity Level 1 (anthrax in >4 years) and Level 3 (anthrax in 1 year). Figure 6. Choropleth maps of human anthrax incidence by rayon (region or country equivalent) by 5-year periods from 1983 – 2003 using natural breaks (Jenks Method) and five classes. References CAN BE PROVIDED UPON REQUEST Results Results of the SaTScan space-time permutation for the time period 1937 to 1978 show that there were four statistically significant clusters when no geographic overlap was allowed and six statistically significant clusters allowing for geographic overlap (Table 1). Figure 2 portrays the distribution of space-time clusters with no geographic overlap across Azerbaijan and Figure 3 portrays the distribution of space-time allowing for overlap. Both the overlapping and non-overlap methods had a single identical primary space-time cluster while the setting allowing for geographic overlap had five secondary clusters compared to three secondary space-time clusters when no overlap was allowed. The primary cluster for both the overlap and non-overlap settings were located in northern Azerbaijan centered near the Azerbaijan/Georgia/Russia border and were five years in length (1943 – 1947). The longest cluster in duration was from 1938 – 1954 and centered in southernmost Azerbaijan between the Caspian Sea and the Iran/Azerbaijan border (this was a secondary cluster). This was a cluster that was identical for each of the two setting applied in the space-time permutation. The choropleth mapping efforts (Figures 5 & 6) indicate a northern shift in total cases reported from the earlier period to the last 5-years of reporting (Figure 5). Total cases reported apparently decreased in southern Azerbaijan, while reporting increased in north central eastern Azerbaijan. A similar trend was illustrated by mapping incidence, suggesting little difference in the geographic patterns between the two data sets. Acknowledgements This cooperative biological research project was funded by the United States Defense Threat Reduction Agency (DTRA) as part of the Biological Threat Reduction Program in Azerbaijan. Figure 2. Total number of villages that reported and/or diagnosed human anthrax across Azerbaijan by year during the time period 1937 to 1998.