Download
1 / 8
90 likes | 252 Views
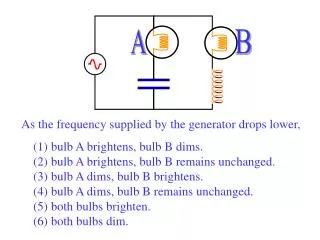
How to read the Humidity chart & do the operating diagram for Cooling tower of Air-Water at 1 atm. Assume you have air of a definite air-water mixture at dry bulb temp T 1 and wet bulb temp T w1. 1. Find point (a) which represents this air on the chart. T w1. (a). T 1.

E N D
How to read the Humidity chart & do the operating diagram for Cooling tower of Air-Water at 1 atm. Assume you have air of a definite air-water mixture at dry bulb temp T1 and wet bulb temp Tw1
1. Find point (a) which represents this air on the chart Tw1 (a) T1
2. The moisture content of this air Y1is given by point (b) kg of water vapor/kg dry air Tw1 (a) (b) Y1 T1
3. The Dew point of this air is given by point (d) to which this air should cool down at constant Humidity (e) Tw1 (a) (b) (c) Y1 T1 (d)
The Adiabatic Saturated Temp Ts and and Saturated humidity Ys of this air is given by points (f&g) . To find these points : • start from point (a) follow the adiabatic cooling line to 100% line on point (e), then read Ts at point (g) and Ys at point (f) • Note: for air water system the wet bulb Tw1 apparently resembles the adiabatic saturation temp. Ts Cs (T-Ts) +Y*ls = Ys*ls (e) (f) Ys Tw1 (b) (a) (c) Y1 T1 Ts (g) (d)
To find Enthalpies h1 of air of point (a) coordinate, follow the enthalpy line through point (a) to its intersection (k) with enthalpy scale line. h1 (k) (a) T1
(m) h* • Equilibrium curve: is a plot of h*vs. TL find Enthalpy h* of a saturated vapor - air mixture in equilibrium with the liquid bulk, j/kg dray air at liquid temp, follow the temp line to its intersection with 100% line and the read h* on enthalpy scale line which given by point m. (k) h1 (a) T1 TL1
Operating diagramAir-Water at 1 atm • This fig. contains the saturated enthalpy carve, and on this plot is point (A) representing the conditions at the bottom of the tower (TL1 & h1). Point (B) represents the conditions at the top of the tower (TL2 & h2). m.G & m.Lare the mass follow rates of gas and liquid (H1 &H2 are water enthalpies) H2 Equilibrium Curve h* (Sat’d air)vs TL A h2 Enthalpy of air – water vapor J/kg dry air H1 Slope =(m.L/m.G)CL h1 B TL1 TL2 Water Temperature