Download
1 / 10
100 likes | 237 Views
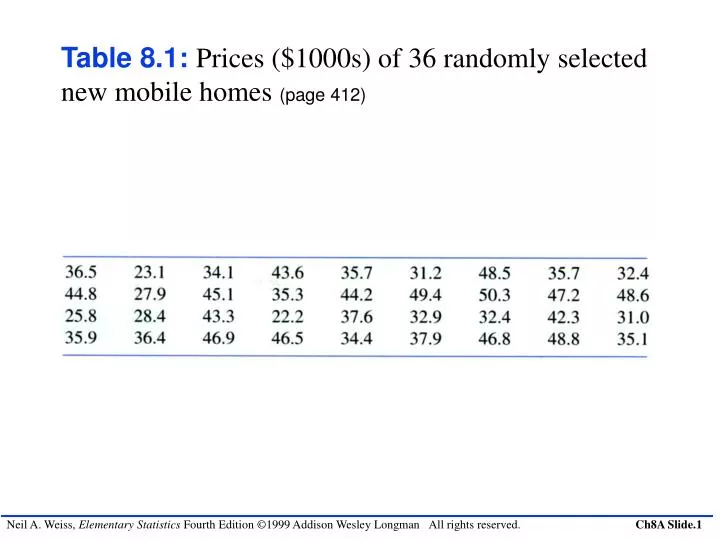
Table 8.1: Prices ($1000s) of 36 randomly selected new mobile homes (page 412). Table 8.2: Prices ($1000s) of another sample of 36 randomly selected new mobile homes (page 415).

E N D
Table 8.1: Prices ($1000s) of 36 randomly selected new mobile homes (page 412)
Table 8.2: Prices ($1000s) of another sample of 36 randomly selected new mobile homes (page 415)
Figure 8.1: Twenty confidence intervals for the mean price of all new mobile homes, each based on a sample of 36 new mobile homes (page 416)
Figure 8.2: (a) 95.44% of all samples have means within 2 standard deviations of . (b) 100(1)% of all samples have means within z/2standard deviations of (page 419)
Table 8.3: Ages of 50 randomly selected people in the civilian labor force (page 422)
Figure 8.3: 90% and 95% confidence intervals for using the data in Table 8.3 (page 423)
Figure 8.4: 95% confidence interval for the meanage, , of all people in the civilian labor force (page 429)
Figure 8.7: Finding the t-value having area 0.05 toits right (page 438)