Download
1 / 68
680 likes | 1k Views
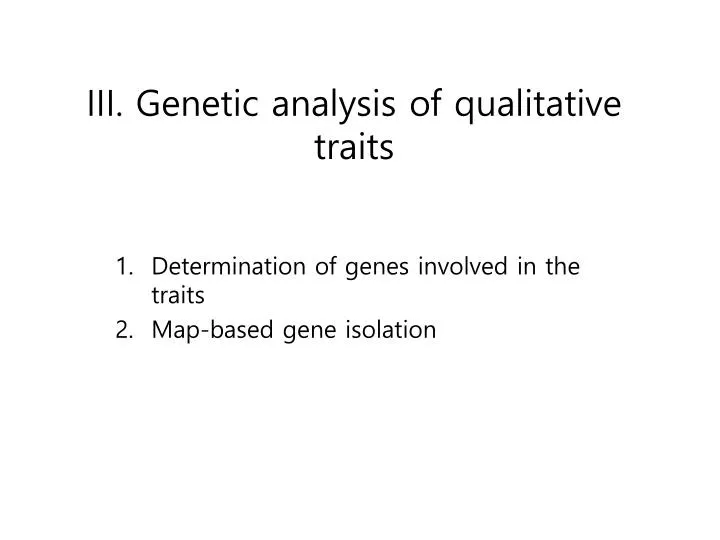
III. Genetic analysis of qualitative traits. Determination of genes involved in the traits Map-based gene isolation. 1. Determination of genes controlling agronomic traits. Steps for gene isolation .

E N D
III. Genetic analysis of qualitative traits Determination of genes involved in the traits Map-based gene isolation
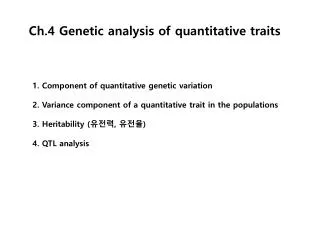
1. Determination of genes controlling agronomic traits Steps for gene isolation Observation of genetic segregation of the target trait in segregating populations --> determining number of genes involved Allelism test if needed (1) Observation of genetic segregation of the target trait in segregating populations • Natural variation quantitative --- continuous variation • qualitative --- discrete variation (distinct classes) • Induced variation(mutant) qualitative
When we observe a genetic segregation of a target trait, we have to decide the segregation mode a)qualitative or quantitative ?? If qualitative b) How many genes involved?? c) single gene Intra-locus interaction ?? more than two genes inter-loci gene interaction ?? qualitative quantitative classified measurable Red: Pink: White Resistant : Susceptible Presence : Abscence Continuous variation Discontinuous variation
b) How many genes involved?? c) Interaction between them?? Chi-square test for proposed segregation ratios Test populations for genetic segregation : Backcross F1 (including Test cross F1) F2 Recombinant inbred lines (RILs) Backcrossed inbred lines (BILs) etc. Make populations for estimating segregation ratio Measure the traits and propose a appropriate segregation ratio considering number of genes and the possible interaction of the genes involved Do chi-square test to test the hypothesis “If the expected segregation ratio is correct?”
Testplant populations generally used for gene tagging, genetic analysis, isolation of genes • F2, F3: DNA analysis in F2, trait evaluation in F3 • BC1F1, BC1F2 : DNA analysis in BC1F1 , trait evaluation in BC1F2 • RILs (recombinant inbred lines) • : inbred lines generation-advance through SSD w/o selection • NILs (near-isogenic lines): through recurrent backcross more than 5 times • BILs (backcrossed inbred lines): • : RILs made from BC1 or BC2 hybrids • ILs (introgression lines): NILs containing specific gene or genes from other species by repeated backcrossing an interspecific hybrid with one of its parent species • CSSLs (chromosome segment substituted lines): similar to ILs; NILs containing specific chromosome segments from other species • Advanced backcross populations: BC2F1, BC2F2 or BC3F1, BC3F2 usually used in interspecific or intergeneric hybrids
An example of determining number of genes There are 4 rice varieties (A, B, C, D) resistant against Brownplanthopper . 1. How many genes are involved in each resistant variety? What is the intra-locus or inter-loci interaction for the resistance? 2. Are they having different gene(s)? 1. Test of segregation ratio - Make segregating populations by crossing between paents of contrasted phenotype - Test of segregation --- chi-square test i)Resist. P(A) x Suscep. P. (P) ↓ F1 Resist.--- Dominant(if Susceptible recessive) ↓ F2 Segregation of R: S = 73 : 27 (Tolal100 plants) - If the resistance is controlled by a single gene? (then segregation ration3:1) Expected ratio:R plants: 3/4 x 100 = 75,S plants: 1/4 x 100 = 25 (O-E)2 (73-75)2 (27-25)2 X2 = Σ = + = 0.2133 E 75 25 in X2Table (df =1) P=0.75~0.50 >0.05 Resistance of variety A is controlled by a single dominant gene. tentatively named the resistance gene as “R(A)”
ii)Using the same procedure, varieties B and C were found to possess single dominant genes. Each was tentatively named as R(B) and R(C). iii) However, variety D showed different segregation ratio Resist. P(A) x Suscep. P. (P) ↓ F1 Resist. (R Dominant) ↓ F2 Segregation of R: S = 132 : 28(Total160 plants) - If R of B is controlled by a single gene?? (3:1) Exp. segr. ratio120:40 - If R of B is controlled by two genes having duplication effect (1 Dom., 1 recess.)? (13:3) Exp. segr. ratio130:30 X2 test for single gene X2 = 4.80 (df=1) P=0.05~0.025 X2 test for two genesX2 = 0.163 P=0.95~0.90 most probable * In this kind of situation, replicated trials using another crossing populations should be done for confirmation. R of B is controlled by two genes having duplication effect (1 Dom., 1 recess.)---> tentatively named them as R(D) and r3(D)
(2) Allelism test among resistant genes : to test if the resistant varieties have the same resistance gene against BPH? i) Dominant genes : by examining the segregation ratio in F2 Parent: R. var. (A) x R. var. (B) ↓ F1 : Resistant ↓ F2 : 1) If all F2 plants are resistantA andB share the same R gene. (allelic) 2) If susceptible plants are segregated in F2, A andB have the different R genes (non-allelic)
ii) Recessive genes : Allelic relationship can be determined in F1. However, F2 plants are also tested to verify the segregation mode. Parent: short (A) x short (B) --- assume that short is recessive ↓ F1 : 1) short: A and B share the same gene for height(allelic) 2) tall: A and B have different genes for height(non-allelic) F2 : 1) All F2 plants are short--- confirmation of results in F1 2) Both tall and short plants will be segregated --- confirmation
Allelism test among dominant genes for resistance Crosses between resistant varieties A x B A x C A x D B x C B x D C x D F1 F1 F1 F1 F1 F1 F2 F2 F2 F2 F2 F2 segregated R:S = 15:1 segregated R:S = 15:1 segregated R:S = 61:3 All plants R All plants R All plants R R(A)=R(D) R(A)=R(C) R(B)=R(C) R(B)=R(D) R(C)=R(D) R(A)=R(B) allelic allelic allelic non-allelic non-allelic non-allelic
: resistance allele 3 R 27 R3(D) 3 R(D) 1 9 R r3(D) 3 R(C) 3 R 9 R3(D) 1 r(D) 1 R 3 r3(D) 3 R 9 R3(D) 3 R(D) R 1 3 r3(D) 1 r(C) 3 S 3 R3(D) 1 r(D) R 1 1 r3(D) Interpretation of CxD F2 R(C) R(D)+r3(D) R : S= 61 : 3
In A x C R(A) R(C) R(C) 3 R9 R(A) 3 r(C) R3 1 3 R3 R(C) r(A) 1 r(C) 1 S1 In A x D 의 경우 R(A=D) R(D=A)+r3(D) R(D=A) R3(D) 3 R R(D=A) r3(D) R 1 (no segregation of S plants) * R(A) = R(D) Conclusion 1) R genesVar.A : R1 Var.B : R1 Var.C : R2 Var.D : R1 + r3 2) R1, R2, r3 are independent genes. • If R(A) and R(C) are linked by 20% RV to each other20%, • what will the segregation ratio be?
2. Isolation of the gene(s) : Map-based approach Steps for map-based gene isolation • Mapping of the interest gene: BSA • Fine or saturated mapping of the target locus • Construction of the physical contig map • Sequence analysis of candidate genes • Confirmation of the target gene • - Gene silencing • - Overexpression • - Complementation test • 6. Progeny test of the transgenic plants
Bulked-segregant analysis (BSA) - Groupingofindividuals or varities by characteristics or genotypes - Make bulks of DNA samples from each individual or varity - Screening the bulks with markers and identify the co-segregating markers ⅹ P2 (rr) P1 (RR) F1 (Rr) (RR) (Rr) (rr) F2 DNA extraction from each plant RR bulk rr bulk F2 DNA bulk If P1 P2 P1 P2 RR bulk rr bulk RR bulk rr bulk (RR) (rr) (RR) (rr) Screening of bulks with markers not linked linked rr plants RR plants rr plants RR plants Marker genotype of each F2 plant
Case study 1: Map-based Isolation of ms-h gene (Plant Journal 54: 190-204. (2008)) • Plant material: Hwacheong ms-h, Milyang23, and F2 population (Hwacheong ms-h Milyang23) • Visual phenotyping of F2 individuals (male sterility) and F3 seeds (after hulling) • DNA extraction: F2 plants • DNA markers: CAPS & STS markers developed from sequence DB’s • Mapping: Mapmaker, Kosambi’s map unit • Genomic DNA Sequencing http://rgp.dna.affrc.go.jp/, http://www.tigr.org/tdb/e2k1/osa1/ http://www.ncbi.nlm.nih.gov/, http://www.genome.arizona.edu/
N-methyl-N-nitrosourea treatment on Hwacheongbyeo panicles Chalky grain mutant Male-sterile lines Hwacheong ms-h Gene isolation Potential use
I. Agronomic characterization of the mutant Parent Mutant
Grain fertility of F1 plants and segregation of F2 seeds for chalkiness in the crosses between Hwacheong ms-h (mutant) and somevarieties
Normally fertile and male-sterile (ms) plants originated from normal and chalky seeds, respectively, in subsequent segregating progenies of Hwacheong ms-h / Hwacheongbyeo
Bulked segregant analysis to identify the chromosome to which ms-h gene belongs Lane 1: Milyang 23, Lane 2: Hwacheongbyeo, Lane 3: Hwacheong ms-h, Lane 4: normal bulk, Lane 5: msms bulk. A: hybridized with RZ323 of chr.8, B: hybridized with RG451 of chr.9, C: hybridized with RZ422 of chr.9
Mapping of ms-h gene ms-h Chromosome 9 <Koh et al., 1999, Euphytica, 106, 57-62 >
Fine mapping of the ms-h locus Saturated map BAC/PAC contig Candidate genes Chromosome 9 28773 cM Globulin-like protein-related SSR592 (5564) 27625 0 25603 Hypothet. protein 5564m 25052 0 1 48920 21824 5564t NAM 1) protein 0 19479 5564p 16900 AP005564 0.1 NAM protein 14594 5564v 0 12535 Core histone H2A/H2B/H3/H4 5564s 11875 0 5564d 1 36856 7195 0 UGPase RG451 7596c 2163 0 cM 7596d 1256 Expressed protein-related 2.5 ms-h(~60,000bp) AC0137596 ms-h 0 341 7596e 3.3 42539 Putative photosystem II protein 0 43053 7596f RZ404 0.4 59761 7596b TC 75636 60559 0 71178 AC0137593 7596a TC 80014 0 71925 7593a 0 85500 Unknown Protein (TC 80014) 2462g 88644
Sequence analysis of candidate genes Mutation site in UGPase1gene (UDP-glucose pyrophosphorylase ) 74-bp intron14 intron15 5' 3' exon 14 exon 15 exon 16 Wild Mutant AGG AAG (single nucleotide substitution) <Woo et al. 2008. Plant J. 54: 190-204>
Cosegregation analysis between SNP/InDel and trait dCAPS marker analysis Comparison of dCAPS marker genotypes with phenotypes in F2 plants from Hwacheong ms-h Hwacheong cross. Genotype 1: MS-h/MS-h, Genotype 2: MS-h/ms-h, Genotype 3: ms-h/ms-h
Expression study RT-PCR analysiswith UGPase1 specific primers RT-PCR analysis with UGPase1-specific primers. FL: fertile leaf, ML: ms leaf, FP: fertile panicle, MP: ms panicle
UGPase1 transcript analysis * : termination codon. : 1-bp deletion site.
Confirmation of UGPase1 gene by transgenic approach • UGPase1 RNA interference: UGPase1 silencing vector (pB7GWIWG2) transformation into Normal Hwacheong • Complementation test: UGPase1 overexpression vector (pCam-LA) transformation into Hwacheong ms-h mutant <Woo et al. 2008. Plant J. 54: 190-204>
BamHII XbaI Bar attR1 T35S UGPase LB attR2 Sm/SpR XbaI Intron CmR EcoRI attR2 UGPase RB attR1 P35S HindIII Confirmation of the target gene RNAi-mediated silencing of UGPase1 gene P35S UGPase UGPase Bar RB intron T35S LB UGPase1 silencing vector (pB7GWIWG2) construction Introduced into normal-seed induced callus by Agrobacterim method
UGPase1–silenced plants became male-sterile. B.Hwacheong plants after ripening period containing the empty vector (left) and transformed by pUGPRNAi (right). C. The enlargement of photograph B. D. Panicles of a vector-transformed plant and UGPase1-RNAi plant at the anthesis stage (left) and after ripening period (right). E. Flower and anther morphology of a vector-transformed plant (left) and UGPase1-RNAi plant (right) at the heading stage. F. I2-KI staining of pollen grains from a vector-transformed plant at the heading stage. G. I-KI staining of pollen grains from UGPase1-RNAi plant at the heading stage.
Expression level analysis of UGPase1 and UGPase2 genes in UGPase1-RNAi plants A. Northern blot analysis of UGPase1 gene expression. B. Quantitative RT-PCR analysis of UGPase1 gene expression. C. Semi-quantitative RT-PCR analysis of the expression of UGPase2 gene. V: empty vector-transformed plant; r4, r11, r15, r23, r29: UGPase1-RNAi plants.
Pleiotropic effect of UGPase1 on both male-sterility and chalky endosperm Spikelet fertility and the ratio of normal to opaque seed of UGPase1-RNAi transformant F1 progenies. All of the F2 plants from opaque seeds were male-sterile.
EcoR I UGPase Tnos HPT P35S LB RB Hind III KanR ori P35S HPT RB UGPase Tnos LB Complementation test of UGPase 1 gene UGPase1overexpression vector (pCam-LA) construction Introduced into ms(chalky)-seed induced callus by Agrobacterim method
UGPase1–overexpressed ms-h plants became fertile. H. Phenotype of Hwacheong ms-h mutant after ripening period containing the empty vector (left) and complemented by the introduction of pUGPCOM (right). I. The enlargement of photograph H. J. Panicles of a vector-transformed plant and the complemented plant at the anthesis stage (left) and after ripening period (right). K. Flower and anther morphology of a vector-transformed plant (left) and the complemented plant (right) at the heading stage. L. I-KI staining of pollen grains from a vector-transformed plant at the heading stage. M. I-KI staining of pollen grains from the complemented plant at the heading stage.
RT-PCR analysis of complementation transgenic plants T0 T1 • RT-PCR analysis of T0 plants. • B. RT-PCR analysis of T1 plants derived from T0 plants (c10, c13). • F: Wild type plant (fertile Hwacheong), • M: Hwacheong gms mutant, c2, c3, c6, c9, c10, c12, c13, c16, c22, c24, c29: complemented plants, V1, V2: empty vector-transformed plants. 10-N1, 10-N2, 10-N3, 10-N4, 10-N5, 10-N6: T1 plants derived from normal seed of c10 transformant, 10-O: T1 plant derived from opaque seed of c10 transformant, 13-N3: T1 plant derived from normal seed of c13 transformant, 13-O: T1 plant derived from opaque seed of c13 transformant, Ubq: ubiquitin.
Pleiotropic effect of UGPase1 on both male-sterility and chalky endosperm T1 seeds were segregated into normal and opaque seed in T0 panicles. grew into male-sterile plants
UGPase(UDP-glucose pyrophosphorylase) • Glucose-1-phosphate + UTP UDP-glucose + PPi (pyrophosphate) • Reversible • in a photosynthetic source tissue G-1-P UDPG sucrose synthesis • in a nonphotosynthetic sink tissue UDPG G-1-P sucrose degradation starch accumulation <Kleczkowski et al., 2004, Plant Physiol. 134, 912-918 >
The role of UGPase in pollen cell wall synthesis Aborted pollen development Fig.12. Possible involvement of UGPase in cell wall synthesis in source and sink tissues. <Kleczkowski et al., 2004, Plant Physiol. 134, 912-918 > Incomplete endosperm development
UDPG (UDP-glucose) Pollen development of ms-h mutant • Take part in cell wall biosynthesis • Act as a precursor for the synthesis of the carbohydrate moiety of glycolipids, glycoproteins, and cell wall components, including callose, pectin, and cellulose Tapetum Tetrad Mononucleate Binucleate Mature Wild type- Mature Mature
Hybrid Breakdown (HB) Case study 2: Map-based Isolation of Hybrid Breakdown TheorAppl Genet 116: 1117-1127 (2009) HB plants in the F2 population from an indx jap cross A postzygotic reproductive barrier observed only in the F2 or later generations of interspecific or intersubspecific crosses A phenomenon of reduced viability or fertility accompanied with retarded growth in hybrid progenies
Reports on HB in plants Hybrid inferiority (=HB) is the result of widespread negative epistasis in a hybrid genetic background. Burke et al.(2001) Annu. Rev. Genet. 35:31–52 In sunflower: between Helianthus annuus and H. petiolaris In rice: between Oryza sativa ssp. japonica and O. s. ssp. indica In cotton : between Gossypium hirsutum and G. barbadense In iris: between Iris fulva and I. brevicaulis
Geneticsof HB in Rice Chromosome 10 Chromosome 11 S10001 RM474 S11004 RM311 S11018 S10019 S10026 RM167 RM184 RM202 S10042 S11045 RM271 S11055 RM258 S11059 S11070 S10072 RM229 RM228 S11077 RM590 RM21 S10083 RM206 RM187 S110106 Chromosome 12 S110112 RM144 RM20A S110117 RM4A RM224 S12012 RM19 RM247 S12029 hwe1 RM277 S12056 RM260 S12094 RM270 RM235 S120109 RM17 • A pair of complementary recessive genes hwd1 and hwd2 • (Fukuoka et al. 1998) • A set of two nuclear genes hwe1 and hwe2 • (Kubo and Yoshimura 2002) • A pair of complementary recessive genes hbd2 and hbd3 • (Matsubara et al. 2007) • A pair of complementary recessive geneshwh1 andhwh2 • (Jiang et al. 2008) Chromosome 2 Chromosome 7 Chromosome 1 S07011 S01005 S02000 RM427 hwd1 S01010 RM481 RM428 S07024 S01027 RM485 S07031 hwh2 S07035 RM211 RM1 hwe2 RM214 hwd2 S02010 S07055 RM259 S02020 hbd3 RM418 RM600 RM432 RM492 S01078 RM11 RM438 S07071 RM129 RM71 RM346 RM306 RM324 RM336 RM424 S01100 S07080 hwh1 S02062 RM488 RM234 RM341 RM429 RM246 S07101 S01127 S02088 RM118 hbd2 RM297 S07118 RM263 RM212 RM172 S01143 RM450 RM248 RM318 S01147 RM420 S02126 S01158 RM425 RM104 S02140 RM240 RM414 RM250
Objectives of this study • To fine-map and identify the candidate genes for hybrid breakdown in rice • To investigate the evolution of hybrid breakdown genes in the genus Oryza
Plant materials RIL-166: An HB line fromMilyang 23(ind)/Tong 88-7(jap) F8 RILs P1 (Milyang 23) P2 (Tong 88-7) RIL-166 RIL-166 hwh2 hwh2 hwh2 Hwh2 × × hwh1 hwh1 hwh1 Hwh1 BC1F2 ⓧ ⓧ Mapping population hwh2 hwh2 hwh2 hwh2 Hwh2 Hwh2 BC1F2 hwh1 hwh1 hwh1 Hwh1 hwh1 Hwh1 Normal 1 Normal 2 Normal 1 Normal 2 HB 1 HB 1
Phenotype of HB plants HB-1/HB-2 F1 P1 P2 HB-1 HB-2 HB-1/HB-2 F1 • Poorly developed root system • Reduced growth • Fewer and small panicles • Normal panicle fertility P2 P1 HB-1 HB-2
Segregation of HB plants in F2 and BCF2 populations BC1F2 RIL-166/Mil.23 (ind) BC1F2 RIL-166/Tong 88 (jap) F2 Mil.23/Tong 88-7 No. of plants Number of panicles A pair of complementary recessive genes, hwh1 and hwh2
Genetic and physical map of the hwh1gene Chromosome 2 Phenotypes N: normal plant HB: HB plant H: heterozygous Genotypes M: Mil. 23 type, T: Tong 88 type, H: heterozygote
5204 5’ 3’ Exon 2 Exon 1 Exon 3 1 624 716 992 3484 5464 DNA sequence comparison between Hwh1 and hwh1 alleles, encoding putative glucose-methanol-choline oxidoreductase (Loc_Os02g40840) hwh1 Hwh1 Aspartic acid (Hwh1) →Tyrosine (hwh1)
dCAPS marker analysis for the SNP in Hwh1 gene • Co-segregation analysis in RIL-166/Tong 88-7 BC1F2 population using dCAPS marker, S0299M. One-base mismatched forward primer generated a SalI specific site, 5′-cgtattgcctcgcaaatggcatcgtc-3′; reverse primer, 5′-tggtcctcgtaacaa tcatatacgct-3′. • (M: Milyang 23, T: Tong 88-7,R: RIL-166, Phenotypes–N: normal plant, H: segregating, HB: HB plant) Phenotype 200 bp 100 bp
1A-24012.R LB RB 6240bp Phenotype manifestation using aT-DNA insertional mutant line into LOC_Os02g40840(glucose-methanol-choline oxidoreductase; Hwh1) Exon2 Exon1 Exon3 hwh2 hwh2 Hwh1 hwh1 Dongjinbyeo (Normal) T-DNA mutant homozygous (HB) Dongjinbyeo (Normal) T-DNA mutant homozygous (HB)