Download

1 / 25
250 likes | 253 Views
Lesson 2. Output and input measurement: Partial productivity measures and aggregation. Productive efficiency and innovation. Diego Prior Dpt. of Business. Outline for today. 2.1. Measuring outputs and inputs. 2.2. Partial productivity indicators. 2.3 TFP indices. 2.4. Applications.

E N D
Lesson 2. Output and input measurement: Partial productivity measures and aggregation Productive efficiency and innovation Diego Prior Dpt. of Business
Outline for today • 2.1. Measuring outputs and inputs. • 2.2. Partial productivity indicators. • 2.3 TFP indices. • 2.4. Applications.
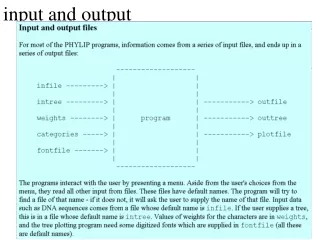
2.1. Measuring outputs and inputs. What is Production? Transformation of resources (inputs) into products and services (outputs). Examples: Agriculture: Grain farming Inputs: land; labour; biochemical input (fertiliser, pesticides, seeds); capital (equipment, power and buildings). Output: corn, soybeans, wheat. Industry: Cement production Inputs: energy in calories; blue and white-collar workers (man hours/year); book value of machinery and equipment; raw materials (especially: limestone). Output: cement production per year (tonnes). Services: Urban transport with busses Inputs: staff; fuel; vehicles. Output: vehicle kilometres.
Problems: Sometimes there are positive or negative external effects in production. Example: Electricity generation using fossil fuels creates pollutants like sulphur dioxide and nitrogen oxide. The internal organisation of production processes (including decision-making across different hierarchical levels, intermediate production stages, etc.) is ignored (black box models). Problem of accurate measurement of inputs and outputs. Example: Labour in agriculture should include farm family members.
Richard Murray (1992), Measuring Public-Sector Output: Throughput Measures workloads and may even come close to input (number of cases) Output Goods or services delivered (number of cases handled) Outcome The result from the point of view of the principal or the customers Bradford, Malt and Oates (1969): Intermediate outputs : hours of service delivered D-output : direct output consumed C-output : outcome indicator reflecting the degree to which the direct outputs translate into welfare improvements as perceived by consumers
2.2. Partial productivity indicators. Source: Prior, D. Vergés, J. and Vilardell, I. (1993), La evaluación de la eficiencia en el sector privado y en el sector público, Instituto de Estudios Fiscales. Madrid
2.3. TFP indices. • When we have just one input and output the TFP change between period 1 and 2 is: • When we have more inputs and outputs we must aggregate using index numbers • A basic property of any TFP index is that when q2=aq1 and x2=bx1, then TFP12=a/b
Index number formulae • When we have more than one input or output we need to find an aggregation method • Four most popular indices are: • Laspeyres (prices dependent) • Paasche (prices dependent) • Fisher (prices dependent) • Divisia/Tornqvist (good property: connected with production theory)
Price Index Numbers • Measure changes (or levels) in prices of a set of commodities. • Let pmjand qmj represent prices and quantities (m-th commodity; m = 1,2,...,M and j-th period or firm j = s, t). • The index number poblem is to decompose value change into price and quantity change components.
Laspeyres price index numbers • Price change index for N goods from period s to period t • pit = price of i-th good in t-th period, qit = quantity • Uses base-period (period s) quantity weights • Share-weighted sum of individual price indices • Very popular in CPI calculations
Paasche price index numbers • Uses current-period (period t) quantity weights • Share-weighted harmonic mean of individual price indices • Paasche Laspeyres - when people respond to relative price changes by adjusting mix of goods purchased (in periods of inflation)
Fisher price index numbers • Fisher index is the geometric mean of the Laspeyres and Paasche index numbers • Paasche Fisher Laspeyres - when consumers respond to relative price changes by adjusting mix of goods purchased (in periods of inflation)
Tornqvist price index numbers • Share-weighted geometric mean of individual price indices • Uses average of value share from period t and period s • Log form is commonly used in calculations - has an approximate percentage change interpretation
Quantity Index Numbers Approaches to the compilation of quantity index numbers. 1. Simply use the same formulae as in the case of price index numbers – simply interchange prices and quantities. 2. Use the index number identity:
Four quantity index numbers To obtain the corresponding quantity index numbers we interchange prices and quantities:
Which index is best for use in TFP studies? • Two methods are used to assess the suitability of index number formulae: • economic theory or functional approach • Exact and superlative index numbers • axiomatic or test approach • Index numbers that satisfy a number of desirable properties • Both approaches suggest that the Fisher and Tornqvist are best (Diewert)
Tornqvist TFP index The Tornqvist has been the most popular TFP index This approach is also know as the Hicks-Moorsteen Approach – defines productivity index simply as the ratio of output and input index numbers.
Properties of index numbers • Used to evaluate index numbers • Economic theory • Axioms • Both suggest Tornqvist and Fisher best for TFP calculations
Economic theory arguments • Laspeyres and Paasche imply simplistic linear production structures • Fisher is exact for quadratic - Tornqvist is exact for translog - both are 2nd-order flexible forms - thus “superlative” indices • If we assume technical efficiency, allocative efficiency and CRS, then Tornqvist and Fisher indices can be interpreted as production function shift (technical change)