Download
1 / 1
10 likes | 149 Views
The Principle of Gravitational lensing (single lens case). The Galactic Bulge is the Microlensing Planet Search Target Field.

E N D
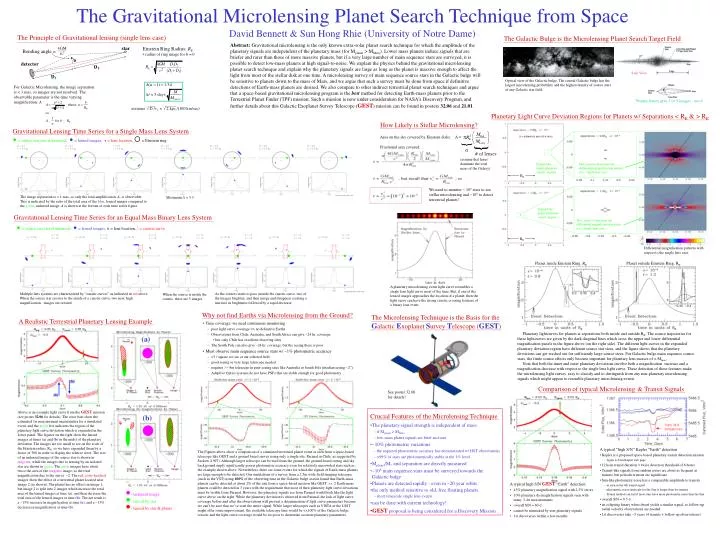
The Principle of Gravitational lensing (single lens case) The Galactic Bulge is the Microlensing Planet Search Target Field Abstract: Gravitational microlensing is the only known extra-solar planet search technique for which the amplitude of the planetary signals are independent of the planetary mass (for Mplanet > MMars). Lower mass planets induce signals that are briefer and rarer than those of more massive planets, but if a very large number of main sequence stars are surveyed, it is possible to detect low-mass planets at high signal-to-noise. We explain the physics behind the gravitational microlensing planet search technique and explain why the planetary signals are large as long as the planet is massive enough to affect the light from most of the stellar disk at one time. A microlensing survey of main sequence source stars in the Galactic bulge will be sensitive to planets down to the mass of Mars, and we argue that such a survey must be done from space if definitive detections of Earth-mass planets are desired. We also compare to other indirect terrestrial planet search techniques and argue that a space-based gravitational microlensing program is the best method for detecting Earth-mass planets prior to the Terrestrial Planet Finder (TPF) mission. Such a mission is now under consideration for NASA’s Discovery Program, and further details about this Galactic Exoplanet Survey Telescope (GEST) mission can be found in posters 32.06 and 21.01. star 4GM rc2 • Einstein Ring Radius: RE • radius of ring image for b = 0 Bending angle = The Gravitational Microlensing Planet Search Technique from SpaceDavid Bennett & Sun Hong Rhie (University of Notre Dame) b detector D2 Side View D1 Optical view of the Galactic bulge. The central Galactic bulge has the largest microlensing probability and the highest density of source stars of any Galactic star field. For Galactic Microlensing, the image separation is < 1 mas, so images are not resolved. The observable parameter is the time varying magnification: A * *binary lenses give 3 or 5 images - not 4 assumes D /v 2 kpc /(100 km/sec) Planetary Light Curve Deviation Regions for Planets w/ Separations < RE & > RE How Likely is Stellar Microlensing? Gravitational Lensing Time Series for a Single Mass Lens System = source star size if unlensed, = lensed images, = lens location, = Einstein ring Area on the sky covered by Einstein disks: A = ( = planetary mass fraction) } } Fractional area covered: s # of lenses (assume that lenes dominate the total mass of the Galaxy) Expand the major planetary caustic regions The caustics determine the differential magnification pattern w.r.t. single lens case. RE We need to monitor ~ 106 stars to see stellar microlensing and ~108 to detect terrestrial planets! The image separation is < 1 mas, so only the total amplification, A, is observable. This is indicated by the ratio of the total area of the blue, lensed images compared to the green, unlensed image. A is shown at the bottom of each time series figure. Maximum A = 3.3 Expand the major planetary caustic region Gravitational Lensing Time Series for an Equal Mass Binary Lens System The caustics determine the differential magnification pattern w.r.t. single lens case. = source star size if unlensed, = lensed images, = lens location, = caustic curve RE Differential magnification patterns with respect to the single lens case. Planet inside Einstein Ring, RE Planet outside Einstein Ring, RE A planetary microlensing event light curve resembles a single lens light curve most of the time. But, if one of the lensed images approaches the location of a planet, then the light curve can have the strong caustic crossing features of a binary lens event. Multiple lens systems are characterized by “caustic curves” as indicated in red above. When the source star crosses to the inside of a caustic curve, two new, high magnification, images are created. As the sources starts to pass outside the caustic curve, two of the images brighten, and then merge and disappear creating a increase in brightness followed by a rapid decrease. When the source is inside the caustic, there are 5 images. Why not find Earths via Microlensing from the Ground? The Microlensing Technique is the Basis for the Galactic Exoplanet Survey Telescope (GEST) A Realistic Terrestrial Planetary Lensing Example • Time coverage: we need continuous monitoring • poor light curve coverage => no definitive Earths • Observations from Chile, Australia, and South Africa can give ~24 hr. coverage • but, only Chile has excellent observing sites. • The South Pole can also give ~24 hr. coverage, but the seeing there is poor. • Must observe main sequence source stars w/ ~1% photometric accuracy • >3 / square arc sec at our selected field • good seeing or very large telescope needed • requires >> 8m telescope in poor seeing sites like Australia or South Pole (median seeing ~2”) • Adaptive Optics systems do not have PSFs that are stable enough for good photometry Planetary lightcurves for planets at separations both inside and outside RE. The source trajectories for these lightcurves are given by the dark diagonal lines which cross the upper and lower differential magnification panels in the figure above (on the right side). The different light curves in the expanded planetary deviation region have different source star sizes, and the figure shows that the planetary deviations can get washed out for sufficiently large source sizes. For Galactic bulge main sequence source stars, the finite source effects only become important for planetary lens masses of < Mmars. Note that both the inner and outer planetary deviations involve both a magnification increase and a magnification decrease with respect to the single lens light curve. These detection of these features make the microlensing light curves easy to classify and to distinguish from any non-planetary microlensing signals which might appear to resemble planetary microlensing events. (a) Comparison of typical Microlensing& Transit Signals See poster 32.06 for details! Above is an example light curve from the GEST mission (see poster 32.06 for details). The error bars show the estimated 1 measurement uncertainties for a simulated event, and the green box indicates the region of the planetary light curve deviation which is expanded in the lower panel. The figures on the right show the lensed images at times (a) and (b) in the midst of the planetary deviation. The images are too small to see on the scale of the Einstein radius, RE, so we have expanded them by a factor of 300 in order to display the relative sizes. The size of an unlensed image of the source star is shown inmagenta, while the images due to lensing by an isolated star are shown in green. The green images have about twice the area of the magenta image, so the total magnification due to the star is ~2. The red, cross-hatched images show the effect of a terrestrial planet located near image 2 (as shown). The planet has no effect on image 1, but image 2 is split into 2 images which increase the total area of the lensed images at time (a), and then decrease the total area of the lensed images at time (b). The net result is a ~15% increase in magnification at time (a), and a ~15% decrease in magnification at time (b). Crucial Features of the Microlensing Technique (b) • The planetary signal strength is independent of mass • if Mplanet MMars • low-mass planet signals are brief and rare • ~10% photometric variations • the required photometric accuracy has demonstrated w/ HST observations • >99% of stars are photometrically stable at the 1% level • Mplanet/M* and separation are directly measured • ~108 main sequence stars must be surveyed towards the Galactic bulge • Planets are detected rapidly - even in ~20 year orbits • the only method sensitive to old, free floating planets • short timescale single lens events • can be done with current technology! • GEST proposal is being considered for a Discovery Mission A typical “high S/N” Kepler “Earth” detection • Kepler is a proposed space-based planetary transit detection mission • figure is from Kepler web page • 12 hour transit duration = twice detection threshold of 6 hours • Transit-like signals from random errors are about as frequent as transits, but periodic transits are significant. • Sun-like photometry noise has a comparable amplitude to transits • as seen in the 4th transit signal • photometric noise timescale for the Sun is longer than for transits • Transit method can fail if most stars have more photometry noise than the Sun. • overall S/N = 8.5 • an eclipsing binary white dwarf yields a similar signal, so follow-up radial velocity observations are needed • 1st discoveries take ~5 years (4 transits + follow-up observations) The Figures above show a comparison of a simulated terrestrial planet event as seen from a space-based telescope like GEST and a ground based survey using only a single site, Paranal in Chile, as suggested by Sackett (1997). Although larger telescope can be used from the ground, the ground-based seeing and sky background imply significantly poorer photometric accuracy even for relatively uncrowded stars such as the example shown above. Nevertheless, there are some events for which the signals of Earth-mass planets are large enough to be detected. Our simulations of a survey from a 2.5m wide-field imaging telescope (such as the VST) using 100% of the observing time in the Galactic bulge season found that Earth-mass planets can be detected at about 2% of the rate from a space-based mission like GEST: i.e. 2 Earth-mass planets could be detected in 3 years with the requirement that most of their planetary light curve deviations must be visible from Paranal. However, the planetary signals see from Paranal would look like the light curve above on the right. While the planetary deviation is observed from Paranal, the lack of light curve coverage before and after the observations will prevent a determination of light curve parameters because we can’t be sure that we’ve seen the entire signal. While larger telescopes such as VISTA or the LSST might offer some improvement, the available telescope time would be <<100% of the Galactic bulge season, and the light curve coverage would be too poor to determine accurate planetary parameters. A typical high S/N GEST “Earth” detection • 45% planetary magnification signal with 2.5% errors • 10% planetary de-magnification signals seen with many 3-4 measurements • overall S/N = 60 • cannot be mimicked by non-planetary signals • 1st discoveries within a few months - unlensed image - lensed by star - lensed by star & planet