Download
1 / 17
170 likes | 175 Views
Comparison of data distributions: the power of Goodness-of-Fit Tests. B. Mascialino 1 , A. Pfeiffer 2 , M.G. Pia 1 , A. Ribon2, P. Viarengo 3 1 INFN Genova, Italy 2 CERN, Geneva, Switzerland 3 IST – National Institute for Cancer Research, Genova, Italy. IEEE – NSS 2006

E N D
Comparison of data distributions: the power of Goodness-of-Fit Tests B. Mascialino1, A. Pfeiffer2, M.G. Pia1, A. Ribon2, P. Viarengo3 1INFN Genova, Italy 2CERN, Geneva, Switzerland 3IST – National Institute for Cancer Research, Genova, Italy IEEE – NSS 2006 San Diego, October 29-November 5, 2006
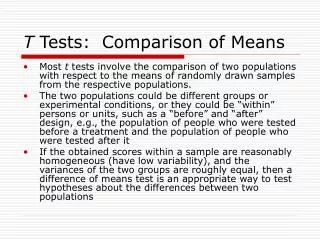
SAMPLE SAMPLE 1 ONE-SAMPLE PROBLEM THEORETICAL DISTRIBUTION SAMPLE 2 TWO-SAMPLE PROBLEM Goodness of Fit testing Goodness-of-fit testing is the mathematical foundation for the comparison of data distributions • Regression testing • Throughout the software life-cycle • Online DAQ • Monitoring detector behaviour w.r.t. a reference • Simulation validation • Comparison with experimental data • Reconstruction • Comparison of reconstructed vs. expected distributions • Physics analysis • Comparisons of experimental distributions • Comparison with theoretical distributions Use cases in experimental physics
http://www.ge.infn.it/statisticaltoolkit/ G.A.P Cirrone, S. Donadio, S. Guatelli, A. Mantero, B. Mascialino, S. Parlati, M.G. Pia, A. Pfeiffer, A. Ribon, P. Viarengo “A Goodness-of-Fit Statistical Toolkit” IEEE- Transactions on Nuclear Science (2004), 51 (5): 2056-2063. B. Mascialino, M.G. Pia, A. Pfeiffer, A. Ribon, P. Viarengo “New developments of the Goodness-of-Fit Statistical Toolkit” IEEE- Transactions on Nuclear Science (2006), 53 (6), to be published
TWO-SAMPLE PROBLEM GoFalgorithmsin theStatistical Toolkit • Binned distributions • Anderson-Darling test • Chi-squared test • Fisz-Cramer-von Mises test • Tiku test (Cramer-von Mises test in chi-squared approximation) • Unbinned distributions • Anderson-Darling test • Anderson-Darling approximated test • Cramer-von Mises test • Generalised Girone test • Goodman test (Kolmogorov-Smirnov test in chi-squared approximation) • Kolmogorov-Smirnov test • Kuiper test • Tiku test (Cramer-von Mises test in chi-squared approximation) • Weighted Kolmogorov-Smirnov test • Weighted Cramer-von Mises test
Power of GoF tests • Do we really need such a wide collection of GoF tests? Why? • Which is the most appropriate test to compare two distributions? • How “good” is a test at recognizing real equivalent distributions and rejecting fake ones? Which test to use? • No comprehensive study of the relative power of GoF tests exists in literature • novel research in statistics (not only in physics data analysis!) • Systematic study of allexisting GoF tests in progress • made possible by the extensive collection of tests in the Statistical Toolkit
Parent distribution 1 Parent distribution 2 Pseudo-experiment: a random drawing of two samples from two parent distributions GoF test Sample 1 n Sample 2 n N=10000 Monte Carlo replicas Confidence Level = 0.05 # pseudoexperiments with p-value < (1-CL) Power = # pseudoexperiments Method for the evaluation of power The power of a test is the probability of rejecting the null hypothesis correctly
Analysis cases • Data samples drawn from different parent distributions • Data samples drawn from the same parent distribution • Applying a scale factor • Applying a shift • Use cases in experimental physics • Signal over background • “Hot channel”, dead channel • etc. Power analysis on a set of reference mathematical distributions Power analysis on some typical physics applications Is there any recipe to identify the best test to use?
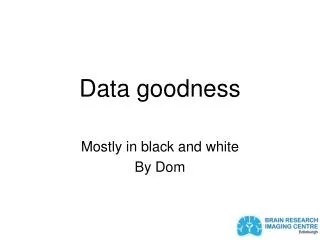
Gaussian Uniform Exponential Double Exponential Cauchy Exponential Left Tailed Contaminated Normal Distribution 1 Pareto Contaminated Normal Distribution 2 α= 1.0 α= 2.0 α= 3.0 α= 4.0 Parent reference distributions
TAILWEIGHT SKEWNESS
Compare different distributions Parent1 ≠ Parent2 Unbinned distributions
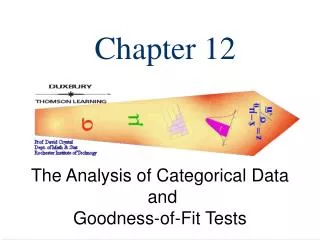
KS WKSB WKSAD CvM WCvM AD K Empirical power (%) Symmetric vs Skewed W CN1 vs CN2 Medium tailed vs Medium tailed The power increases as a function of the sample size CvM GAUSSIAN vs CN2 PARETO1 vs PARETO2 K AD Medium tailed vs Medium tailed Short tailed vs Short tailed Empirical power (%) Empirical power (%) W KS Symmetric vs skewed Skewed vs Skewed WCvM WKSB EXPONENTIAL LEFT TAILED vs PARETO1 K Short tailed vs Medium tailed Empirical power (%) W Skewed vs Skewed WKSAD
Samples size = 50 Samples size = 15 EXPONENTIAL vs PARETO Empirical power (%) Empirical power (%) FLAT vs OTHER DISTRIBUTIONS T1 – T2 S1 – S2 T1 – T2 N S1 – S2 POWER CORRELATION COEFFICIENTS 0.409 0.091 0.181 p<0.0001 p<0.0001 p<0.0001 The power varies as a function of the parent distributions’ characteristics General recipe p<0.0001
LINEAR MULTIPLE REGRESSION INCLUDE BOTH PARENT DISTRIBUTIONS’ CHARACTERISATION INCLUDE SAMPLES SIZE p<0.0001 Standardised coefficients analysis: < < Quantitative evaluation of GoF tests power We propose an alternative quantitative method to evaluate the power of various GoF tests.
Binned distributions Compare different distributionsParent1 ≠ Parent2
χ2 = (38.91±0.49) CvM = (92.9 ± 0.26) χ2 = (98.67±0.12) CvM = (100.0 ± 0.0) χ2 = (77.72±0.42) CvM = (99.98 ± 0.02) χ2 = (50.32±0.50) CvM = (99.79 ± 0.05) χ2 = (65.04±0.48) CvM = (79.55 ± 0.40) χ2 = (33.23±0.47) CvM = (88.57 ± 0.32) χ2 = (100.0±0.0) CvM = (100.0 ± 0.0) χ2 = (100.0±0.0) CvM = (100.0 ± 0.0) χ2 = (92.83±0.26) CvM = (99.97 ± 0.02) χ2 = (99.95±0.02) CvM = (100.0 ± 0.0) Preliminary results DOUBLE EXPONENTIAL Sample size = 1000 Number of bins = 20 GAUSSIAN CAUCHY CN1 DOUBLE EXPONENTIAL CAUCHY CN1 CN2
Conclusions • No clear winner for all the considered distributions in general • the performance of a test depends on its intrinsic features as well as on the features of the distributions to be compared • Practical recommendations • first classify the type of the distributions in terms of skewness and tailweight • choose the most appropriate test given the type of distributions evaluating the best test by means of the quantitative model proposed • Systematic study of the power in progress • for both binned and unbinned distributions • Topic still subject to research activity in the domain of statistics