Download
1 / 30
310 likes | 511 Views
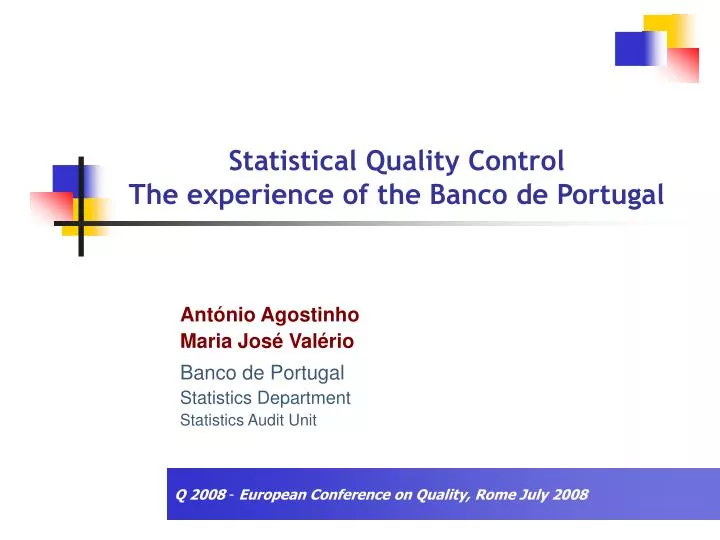
Statistical Quality Control The experience of the Banco de Portugal. António Agostinho Maria José Valério Banco de Portugal Statistics Department Statistics Audit Unit. Q 2008 - European Conference on Quality, Rome July 2008. Outline. The Statistics Department Quality Control Procedures

E N D
Statistical Quality ControlThe experience of the Banco de Portugal António Agostinho Maria José Valério Banco de Portugal Statistics Department Statistics Audit Unit Q 2008- European Conference on Quality, Rome July 2008
Outline • The Statistics Department • Quality Control Procedures • Statistics Audit • Institutional Cooperation • Conclusions and Prospects Ahead
Statistics Department • Created in 1997 to cope with rising statistical requirements (in particular in the framework of the Monetary Union) • Centralized statistical function allowing: • The concentration of the available statistical skills; • The increase of capacity to face the challenges resulting from building up the European System of Central Banks; • The improvement of efficiency gains and the enhancing of statistical quality control at all levels of the statistical process (collection, processing, analysis and dissemination); • The adoption of consistent methodological approaches; and, • An easier data sharing and coordination among all the staff in charge of statistical production.
Statistics Dissemination Unit Total: 10 (Univ. Deg. 8) Executive Management Total:2 (Univ. Deg. 2) Central Credit RegisterInformation Unit Total: 14 (Univ. Deg. 3) Staff Support Unit Total: 13 (Univ. Deg. 3) Statistics Audit Unit Total: 3 (Univ. Deg. 3) MethodologicalDevelopments Unit Total: 3 (Univ. Deg. 3) National Financial Accounts and Securities Statistics Division Total: 23 (Univ. Deg. 17) Balance of Payments and Int.Invest. Position Statistics Division Total: 37 (Univ. Deg. 15) Monetary and FinancialStatistics and Central CreditRegister Division Total: 20 (Univ. Deg. 11) Central Balance-Sheet Division Total: 32 (Univ. Deg. 23) Employees with university degree 88 ( 56% ) Other employees 69 ( 44% ) Total 157 December 2007 • Statistics Department • Organization Chart
Statistics Department • Four Divisions Four different areas of statistical production • Vertical organization in each Division • Regular hierarchical statistical production meetings (on a monthly basis) • Internal technical task forces to deal with transversal issues
Quality Control Procedures • Quality control procedures along all the phases of statistical production process: • Data collecting • Data processing and analysis • Statistics dissemination
Quality Control Procedures • Data Collecting - 1 • Data collecting is based on legal provisions • Involvement of the reporting institutions is pursued • For more complex changes in collection systems working groups are created • Detailed reporting instructions and handbooks are delivered to the reporting institutions • Appointment of contact persons – respondents for each specific statistical data submission (training sessions and regular meetings)
Quality Control Procedures • Data Collecting - 2 • Specific designed software is made available to the reporting institutions - IT tests and consistency tests on elementary data • BP net – a secure electronic communication system between the Banco de Portugal and the other financial institutions • Feedback to reporters – the CCR and CBS experiences • Statistical reporting indicators
Quality Control Procedures • Data Collecting - 3 Quality Assessment Reports – Major Financial Groups • Cross-checking data reported by MFIs: • MFIs’ report to money and banking statistics (MBS) versus accounting data • MFIs’ report to MBS versus report for Central Credit Register • MFIs’ report to MBS versus data collected/reported for securities statistics • Securities portfolios versus securities issues • MFIs’ report to MBS versus report for BoP statistics (external assets and liabilities) • High level periodical statistical meetings
Quality Control Procedures • Data processing and analysis - 1 • Full compliance with the international methodological framework: • concepts and definitions • scope of statistics • classification and sectorization systems • valuation rules • recording principles • Adjustments and/or appropriate substitute measures are developed when the source data are not in accordance with the standards
Quality Control Procedures • Data processing and analysis - 2 • Validation tests performed on individual and/or aggregated data and also at different phases of data processing – source data, intermediate data and final statistical data: • internal consistency • temporal consistency • cross-check control • Additional control in the framework of Financial Accounts compilation
Quality Control Procedures • Statistical Dissemination - 1 • Meeting the users’ needs and the statistical reporting requirements of International Organizations • Main features of the statistics dissemination: • Release in time according to a pre-announced schedule • Clear and understandable presentation • Workshops with media and media references monitoring • Monthly, free of charge, to all users at the same time, in the BdP website: • Statistical Bulletin (also available in paper and CD-ROM) • BP stat – allows online access to the interactive database of BdP • Assistance to users – contact points in BdP website and in the Statistical Bulletin
Quality Control Procedures • Statistical Dissemination - 2 • BP stat | Statistics online | facilities: • Portuguese and English versions; • Data under two formats: time series and multidimensional analysis; • Data in hierarchical structure – tree of statistical domains; • Data and metadata may be accessed, downloaded or printed; • Internet links to the relevant metadata references; • Predefined and/or personalised tables (“Favourites” option); • “Alert” messages by email to the users; and, • Glossary, search, calendar and help options are available.
Quality Control Procedures • Quality Control Matrix
Statistics Audit • Main purposes (1) • Analyse and evaluate the different phases of statistical production procedures in place, from source data collection up to final statistics compilation and dissemination • Analyse the organizational and functioning aspects, in particular evaluate the burden and the share of functions and responsibilities in the statistical production process • Evaluate the efficiency of the procedures in place, identifying the good practices as well as improvement needs
Statistics Audit • Main purposes (2) • Contribute to enhance methods and applied techniques and to improve the statistical production quality by issuing, when it applies, suggestions/ recommendations on current practices or by suggesting new procedures and/or organizational arrangements • Encourage and promote the share and comparison of good practices and procedures among the different areas of the Statistics Department
Statistics Audit • Methodological approach – AK list (1) Initial appointment with the responsible of the unit in charge of the statistics under audit Collect, organize and analyse the documentation made available by the unit Submission of the “Self Assessment Questionnaire” Fieldwork Definition of a flow chart on the information circuit Preparation of the Check List of procedures
Statistics Audit • Methodological approach – AK list (2) Joint analysis with the unit’s manager of the Self Assessment Questionnaire Graphical assessment of the statistical production system (radar chart) Report on the statistical audit process (1st draft) – submission to the unit under audit Joint evaluation of the comments from the unit under audit Final report on the statistical audit process – submission to the Head of the Statistics Department
Statistics Audit • Self Assessment Diagram (1) • The self assessment questionnaire is the basis for the presentation of the radar chart • Two sets of answers to the questionnaire – one, in the beginning of the audit process, from the unit under audit and another, at the end, from the Statistics Audit Unit – are contrasted graphically in a statistical production assessment diagram
Self Assessment Diagram (Securities Issues Unit (SIET) Accessibility Relevance Staff Functions Share 5 Metadata Accessibility System Adequacy 4 Dissemination Clearness and Coverage User Satisfaction 3 2 Consistency with other Statistics Overall Relevance 1 Serviceability 0 Integrity Temporal Consistency Transparency Degree Dissemination Punctuality Overall Coverage Methodological Soundness Intermediary and Final Data Validation Methodological Soundness Degree Reporting Compliance Elementary Data Quality 1 - Very low 2 - Low SIET Unit 3 - Medium 4 - High Accuracy and Reliability 5 - Very high • Statistics Audit • Self Assessment Diagram (2)
Self Assessment Diagram (Securities Issues Unit (SIET) versus Statistics Audit Unit (NAE)) Accessibility Relevance Staff Functions Share 5 Metadata Accessibility System Adequacy 4 Dissemination Clearness and Coverage User Satisfaction 3 2 Consistency with other Statistics Overall Relevance 1 Serviceability 0 Integrity Temporal Consistency Transparency Degree Dissemination Punctuality Overall Coverage Methodological Soundness Intermediary and Final Data Validation Methodological Soundness Degree Reporting Compliance Elementary Data Quality 1 - Very low SIET Unit 2 - Low 3 - Medium NAE 4 - High Accuracy and Reliability 5 - Very high • Statistics Audit • Self Assessment Diagram (3)
Statistics Audit • Overall assessment of the statistical audit operations (1) The overall assessment is quite significant: • The deep interest and good collaboration revealed by those intervening in the statistical production systems audited • These operations allow a detailed assessment on the current features of the statistical systems in place • The possibility of conveying upwards the desires and aspirations as well as the shortcomings faced by the responsibles of the units under auditing, which, otherwise, might encounter more constraints before being acknowledged
Statistics Audit • Overall assessment of the statistical audit operations (2) • The share in all Department of procedures and good practices in place • Most of the suggestions/ recommendations raised by the statistical auditors and accepted by the units under audit are already being implemented or are included in the unit’s planning for the years ahead • The relevance of the follow-up of the implementation of suggestions/ recommendations
Institutional Cooperation More efficient statistical production processes: • Facilitates data sharing and good practices’ diffusion; • Promotes the use of harmonized statistical methodologies - thus improving statistical data comparability; • Helps reducing reporting burden and data redundancy; and, • Enhances the clarification of responsibilities and areas of competence of the parties involved.
Institutional Cooperation New Statistical National Law(May 2008) • Some highlights: • Banco de Portugal became a national statistical authority in the same level playing field as Statistics Portugal, without prejudice of their independence; • This new law emphasizes the importance of ensuring an efficient cooperation and the need for them to develop models of cooperation considered as adequate to fulfil their role in the NSS; and, • The principles of the European Statistics Code of Practice are also formally adopted in this new legal framework.
Institutional Cooperation In national terms (1) • In the framework of theHigh Council of Statistics (HCS) – the body on top of the Portuguese NSS; • Other bilateral/multilateral initiatives: • 1) 1998 - Protocol with Statistics Portugal (SP) and Ministry of Finance (MF) in the field of IMF Special Data Dissemination Standard (SDDS); • 2) 1998 - Protocol on the compilation of Portuguese National Accounts - shared responsibility between SP (non financial accounts) and BdP (financial accounts) – updated in 2001 and 2007; • 3) 1999 – Protocol with SP for the joint conduction from 2000 onwards, in partnership, of a Quarterly Survey on non Financial Corporations; • 4) 2004 – Two protocols in the field of Balance of Payments, with SP and General Directorate of Tourism, focusing on a survey of cross-border movement of travellers and a survey on international tourist expenditure (the last was conducted in 2007);
Institutional Cooperation In national terms (2) 5) 2006 - Protocol with SP, (the first was signed in 2000) for the conduction of a Survey to the Households Indebtedness and Wealth; 6) 2006 – Protocol with SP and MF, on the compilation of General Government Statistics, Public Debt Statisticsand analysis of Excessive Deficit Report; 7) 2006 – Joint work with SP for the development of a uniqueFile of Statistical Units for the whole NSS; 8) 2006 – Protocol with SP, MF and Ministry of Justice to define a single electronic data submission with data from the financial statements of non financial corporations – IES (formally created by Decree-Law n. 8/2007 of 17th January).
Institutional Cooperation At international level - With ECB and the other EU national central banks in the framework of ESCB; - With Eurostat and the EU national statistical offices under the umbrella of the Memorandum of Understanding (MoU); - In the framework of CMFB (currently the Head of the BdP Statistics Department is also part of the CMFB Executive Body); - With other international organizations namely IMF, BIS, World Bank and OECD; - Technical assistance – several activities in particular, but not exclusively, with the national central banks ant the national statistical offices of the Portuguese-speaking Countries.
Conclusions and Prospects Ahead The appraisal on the work developed so far is quite significant. • Further improvements: • Define a set of structured quality indicators, to be compiled on a regular basis, on the quality of the statistical production; • Improve the already existing quality manuals, exploring further these documents both in a user’s oriented perspective and in a statistical quality control framing; • Enlarge the feedback information currently produced and returned to the reporting institutions; • Define mechanisms to have an adequate feedback from statistics’ users (on statistical data already currently available and on the users’ future needs).
Thank You for your Attention