Download
1 / 1
10 likes | 124 Views
PC Time Series. OLR Anomalies. 91250.0. t 0. 234.6. t 1. -84213.0. t n. 21 Jul 1981. c) ECHAM4/OPYC. d) GFDL_CM2.1. a) AVHRR. b) CSIRO_Mk3.0. 30 Jul 1981. Day -15. Day -10. Day -5. Day 0. 8 Aug 1981. Day 10. Day 15. Day 20. Day 5. c) CGCM3.1 (T47). b) CCSM3.0. a) AVHRR.

E N D
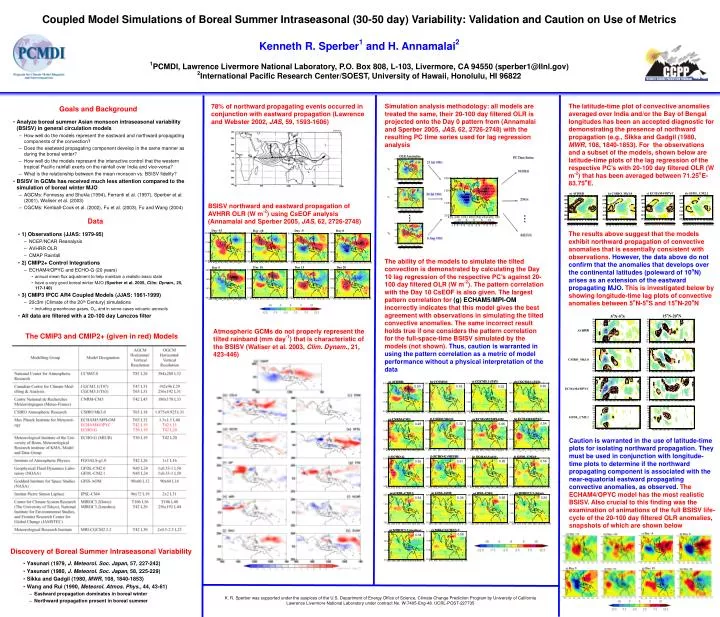
PC Time Series OLR Anomalies 91250.0 t0 234.6 t1 -84213.0 tn 21 Jul 1981 c) ECHAM4/OPYC d) GFDL_CM2.1 a) AVHRR b) CSIRO_Mk3.0 30 Jul 1981 Day -15 Day -10 Day -5 Day 0 8 Aug 1981 Day 10 Day 15 Day 20 Day 5 c) CGCM3.1 (T47) b) CCSM3.0 a) AVHRR d) CGCM3.1 (T63) 0.30 0.90 0.42 0.33 15oN-20oN 5oN-5oS f) CSIRO Mk3.0 h) ECHAM4/OPYC g) ECHAM5/MPI-OM e) CNRM-CM3 0.54 0.32 0.28 0.66 AVHRR j) ECHO-G (MIUB) k) FGOALS-g1.0 i) ECHO-G l) GFDL-CM2.0 0.56 0.26 0.36 0.61 CSIRO_Mk3.0 ECHAM4/OPYC n) GISS-AOM o) IPSL-CM4 m) GFDL-CM2.1 p) MIROC3.2 (hires) 0.64 0.28 0.65 0.28 GFDL_CM2.1 r) MRI-CGCM2.3.2 q) MIROC3.2 (medres) 0.58 0.34 ____________________________________________________________________________________________________________________________________________________________________ Coupled Model Simulations of Boreal Summer Intraseasonal (30-50 day) Variability: Validation and Caution on Use of MetricsKenneth R. Sperber1 and H. Annamalai21PCMDI, Lawrence Livermore National Laboratory, P.O. Box 808, L-103, Livermore, CA 94550 (sperber1@llnl.gov)2International Pacific Research Center/SOEST, University of Hawaii, Honolulu, HI 96822 The latitude-time plot of convective anomalies averaged over India and/or the Bay of Bengal longitudes has been an accepted diagnostic for demonstrating the presence of northward propagation (e.g., Sikka and Gadgil (1980, MWR, 108, 1840-1853). For the observations and a subset of the models, shown below are latitude-time plots of the lag regression of the respective PC’s with 20-100 day filtered OLR (W m-2) that has been averaged between 71.25oE-83.75oE. Simulation analysis methodology: all models are treated the same, their 20-100 day filtered OLR is projected onto the Day 0 pattern from (Annamalai and Sperber 2005, JAS, 62, 2726-2748) with the resulting PC time series used for lag regression analysis 78% of northward propagating events occurred in conjunction with eastward propagation (Lawrence and Webster 2002, JAS, 59, 1593-1606) Goals and Background Day 0 BSISV northward and eastward propagation of AVHRR OLR (W m-2) using CsEOF analysis (Annamalai and Sperber 2005, JAS, 62, 2726-2748) Data The results above suggest that the models exhibit northward propagation of convective anomalies that is essentially consistent with observations. However, the data above do not confirm that the anomalies that develops over the continental latitudes (poleward of 10oN) arises as an extension of the eastward propagating MJO. This is investigated below by showing longitude-time lag plots of convective anomalies between 5oN-5oS and 15oN-20oN The ability of the models to simulate the tilted convection is demonstrated by calculating the Day 10 lag regression of the respective PC’s against 20-100 day filtered OLR (W m-2). The pattern correlation with the Day 10 CsEOF is also given. The largest pattern correlation for (g) ECHAM5/MPI-OM incorrectly indicates that this model gives the best agreement with observations in simulating the tilted convective anomalies. The same incorrect result holds true if one considers the pattern correlation for the full-space-time BSISV simulated by the models (not shown). Thus, caution is warranted in using the pattern correlation as a metric of model performance without a physical interpretation of the data Atmospheric GCMs do not properly represent the tilted rainband (mm day-1) that is characteristic of the BSISV (Waliser et al. 2003, Clim. Dynam., 21, 423-446) The CMIP3 and CMIP2+ (given in red) Models Caution is warranted in the use of latitude-time plots for isolating northward propagation. They must be used in conjunction with longitude-time plots to determine if the northward propagating component is associated with the near-equatorial eastward propagating convective anomalies, as observed. The ECHAM4/OPYC model has the most realistic BSISV. Also crucial to this finding was the examination of animations of the full BSISV life-cycle of the 20-100 day filtered OLR anomalies, snapshots of which are shown below Discovery of Boreal Summer Intraseasonal Variability K. R. Sperber was supported under the auspices of the U.S. Department of Energy Office of Science, Climate Change Prediction Program by University of California Lawrence Livermore National Laboratory under contract No. W-7405-Eng-48. UCRL-POST-227735