Download
1 / 1
10 likes | 201 Views
CALLINECTES SAPIDUS AND UCA SPP. MEGALOPAE INCREASE DUE TO WIND EVENTS ALONG EACH SIDE OF DELAWARE BAY. PATRICK REYNOLDS MARINE ACADEMY OF SCIENCE AND TECHNOLOGY SANDY HOOK, NEW JERSEY. RESULTS. RESULTS CONTINUED. INTRODUCTION. METHOD.

E N D
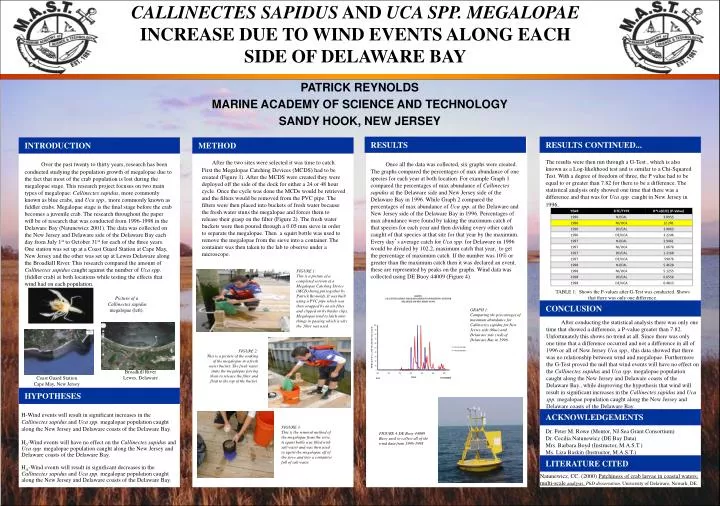
CALLINECTESSAPIDUS AND UCA SPP. MEGALOPAE INCREASE DUE TO WIND EVENTS ALONG EACH SIDE OF DELAWARE BAY PATRICK REYNOLDS MARINE ACADEMY OF SCIENCE AND TECHNOLOGY SANDY HOOK, NEW JERSEY RESULTS RESULTS CONTINUED... INTRODUCTION METHOD After the two sites were selected it was time to catch. First the Megalopae Catching Devices (MCDS) had to be created (Figure 1). After the MCDS were created they were deployed off the side of the dock for either a 24 or 48 hour cycle. Once the cycle was done the MCDs would be retrieved and the filters would be removed from the PVC pipe. The filters were then placed into buckets of fresh water because the fresh water stuns the megalopae and forces them to release their grasp on the filter (Figure 2). The fresh water buckets were then poured through a 0.05 mm sieve in order to separate the megalopae. Then a squirt bottle was used to remove the megalopae from the sieve into a container. The container was then taken to the lab to observe under a microscope. Over the past twenty to thirty years, research has been conducted studying the population growth of megalopae due to the fact that most of the crab population is lost during the megalopae stage. This research project focuses on two main types of megalopae: Callinectes sapidus, more commonly known as blue crabs, and Uca spp., more commonly known as fiddler crabs. Megalopae stage is the final stage before the crab becomes a juvenile crab. The research throughout the paper will be of research that was conducted from 1996-1998 in the Delaware Bay (Natunewicz 2001). The data was collected on the New Jersey and Delaware side of the Delaware Bay each day from July 1st to October 31st for each of the three years. One station was set up at a Coast Guard Station at Cape May, New Jersey and the other was set up at Lewes Delaware along the Broadkill River. This research compared the amount of Callinectes sapidus caught against the number of Uca spp. (fiddler crab) at both locations while testing the effects that wind had on each population. The results were then run through a G-Test , which is also known as a Log-likelihood test and is similar to a Chi-Squared Test. With a degree of freedom of three, the P value had to be equal to or greater than 7.82 for there to be a difference. The statistical analysis only showed one time that there was a difference and that was for Uca spp. caught in New Jersey in 1996. Once all the data was collected, six graphs were created. The graphs compared the percentages of max abundance of one species for each year at both location. For example Graph 1 compared the percentages of max abundance of Callinectes sapidus at the Delaware side and New Jersey side of the Delaware Bay in 1996. While Graph 2 compared the percentages of max abundance of Uca spp. at the Delaware and New Jersey side of the Delaware Bay in 1996. Percentages of max abundance were found by taking the maximum catch of that species for each year and then dividing every other catch caught of that species at that site for that year by the maximum. Every day’s average catch for Uca spp. for Delaware in 1996 would be divided by 102.2, maximum catch that year, to get the percentage of maximum catch. If the number was 10% or greater than the maximum catch then it was declared an event, these are represented by peaks on the graphs. Wind data was collected using DE Buoy 44009 (Figure 4). FIGURE 1: This is a picture of a completed version of a Megalopae Catching Device (MCD) being put together by Patrick Reynolds, It was built using a PVC pipe which was then wrapped by an air filter and clipped on by binder clips. Megalopae tend to latch onto things in passing which is why the filter was used. TABLE 1: Shows the P-values after G-Test was conducted. Shows that there was only one difference. Picture of a Callinectes sapidus megalopae (left). CONCLUSION GRAPH 1: Comparing the percentages of maximum abundance for Callinectes sapidus for New Jersey side (blue) and Delaware side (red) of Delaware Bay in 1996 After conducting the statistical analysis there was only one time that showed a difference, a P-value greater than 7.82. Unfortunately this shows no trend at all. Since there was only one time that a difference occurred and not a difference in all of 1996 or all of New Jersey Uca spp., this data showed that there was no relationship between wind and megalopae. Furthermore the G-Test proved the null that wind events will have no effect on the Callinectes sapidus and Uca spp. megalopae population caught along the New Jersey and Delaware coasts of the Delaware Bay., while disproving the hypothesis that wind will result in significant increases in the Callinectes sapidus and Uca spp. megalopae population caught along the New Jersey and Delaware coasts of the Delaware Bay. FIGURE 2: This is a picture of the soaking of the megalopae in a fresh water bucket. The fresh water stuns the megalopae forcing them to release the filter and float to the top of the bucket. . Broadkill River Lewes, Delaware Coast Guard Station Cape May, New Jersey HYPOTHESES ACKNOWLEDGEMENTS H-Wind events will result in significant increases in the Callinectes sapidus and Uca spp. megalopae population caught along the New Jersey and Delaware coasts of the Delaware Bay. H0-Wind events will have no effect on the Callinectes sapidus and Uca spp. megalopae population caught along the New Jersey and Delaware coasts of the Delaware Bay. HA-Wind events will result in significant decreases in the Callinectes sapidus and Uca spp. megalopae population caught along the New Jersey and Delaware coasts of the Delaware Bay. FIGURE 3: This is the removal method of the megalopae from the sieve. A squirt bottle was filled with salt water and was then used to squirt the megalopae off of the sieve and into a containter full of salt water. Dr. Peter M. Rowe (Mentor, NJ Sea Grant Consortium) Dr. Cecilia Natunewicz (DE Bay Data) Mrs. Barbara Boyd (Instructor, M.A.S.T.) Ms. Liza Baskin (Instructor, M.A.S.T.) FIGURE 4:DE Buoy 44009 Buoy used to collect all of the wind data from 1996-1998 LITERATURE CITED Natunewicz, CC. (2000) Patchiness of crab larvae in coastal waters; multi-scale analysis. PhD dissertation, University of Delaware, Newark, DE.