Download
1 / 4
40 likes | 201 Views
a) South Tobacco Creek watershed. b) Madill sub-watershed. Alberta. Manitoba. Saska- tchewan. MS13. Madill sub-watershed. c) Steppler sub-watershed. BMP3,5. MS9. BMP1. BMP2,3. BMP2,3. BMP3,4. BMP3,5. Steppler sub-watershed. BMP3,4. MS5.

E N D
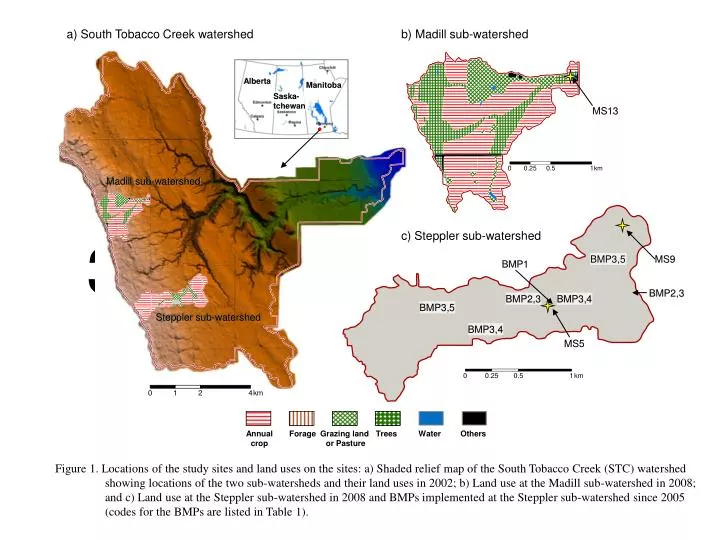
a) South Tobacco Creek watershed b) Madill sub-watershed Alberta Manitoba Saska- tchewan MS13 Madill sub-watershed c) Steppler sub-watershed BMP3,5 MS9 BMP1 BMP2,3 BMP2,3 BMP3,4 BMP3,5 Steppler sub-watershed BMP3,4 MS5 Figure 1. Locations of the study sites and land uses on the sites: a) Shaded relief map of the South Tobacco Creek (STC) watershed showing locations of the two sub-watersheds and their land uses in 2002; b) Land use at the Madill sub-watershed in 2008; and c) Land use at the Steppler sub-watershed in 2008 and BMPs implemented at the Steppler sub-watershed since 2005 (codes for the BMPs are listed in Table 1). Annual crop Forage Grazing land or Pasture Trees Water Others
Phosphorous shares Nitrogen shares Madill (control) sub-watershed Steppler (treatment) sub-watershed Figure 2. Shares of P and N in different forms and in runoff events of different types for the entire study period (1999 – 2008) at the Madill and Steppler sub-watersheds.
b) TN export (Ln(g ha-1)) a) TP export (Ln(g ha-1)) Steppler (treatment) sub-watershed value (Y) c) TP FWMC (Ln(mg L-1)) d) TN FWMC (Ln(mg L-1)) Madill (control) sub-watershed value (X) Pre-BMP (calibration) period data point Post-BMP (BMP implementation) period data point Pre-BMP (calibration) period regression line Post-BMP (BMP implementation) period regression line Figure 3. Simple regression analyses of TP and TN exports and flow-weighted mean concentrations (FWMCs) for all runoff events, showing the effects of BMP implementation without accounting for the effects of hydrologic covariates.
a) P input, all fields b) N input, all fields c) P input, annual cropped fields d) N input, annual cropped fields +4NS +14NS -16NS +7NS -26† -4* +0NS -5** Kg ha-1 yr-1 e) P removal, all fields f) N removal, all fields g) P removal, annual cropped fields h) N removal, annual cropped fields +2NS +1NS +0NS -0NS +12NS +20NS -2NS -14NS Kg ha-1 yr-1 i) P budget, all fields j) N budget, all fields k) P budget, annual cropped fields l) N budget, annual cropped fields -4NS -45* +3NS -4† +16NS -12NS -1NS -6** Kg ha-1 yr-1 Pre-BMP Post-BMP Pre-BMP Post-BMP Post-BMP Post-BMP Post-BMP Post-BMP Post-BMP Pre-BMP Post-BMP Pre-BMP Pre-BMP Pre-BMP Pre-BMP Pre-BMP Madill Steppler Madill Steppler Madill Steppler Madill Steppler Figure 4. Gross N and P inputs, removals and budgets estimated for fields in the Madill and Steppler sub-watersheds. The column height indicates the average value for the period and the vertical bar indicates the full range of the data in the period. The Number above the column is the difference (+ for increase and - for decrease) in average values between the Pre-BMP and Post-BMP periods. Significance level of the difference is determined using a two-way t-test (NS, †, * and ** denote nonsignificant and significant at P ≤ 0.10, 0.05 and 0.01, respectively).