Download
1 / 63
630 likes | 726 Views
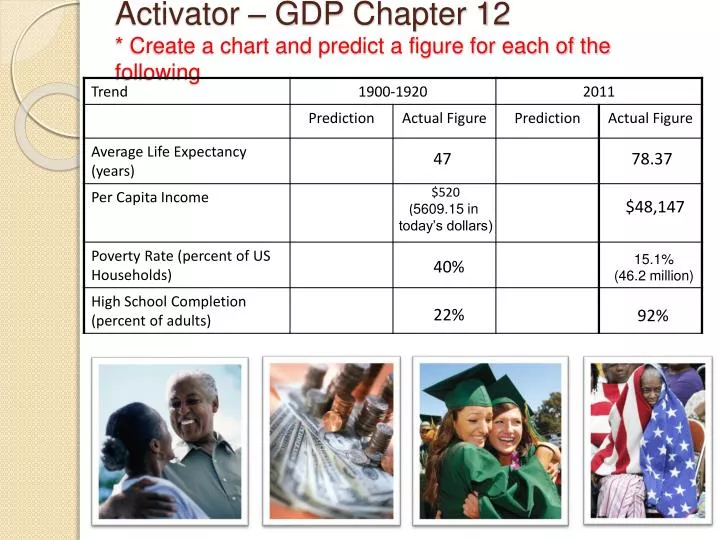
Activator – GDP Chapter 12 * Create a chart and predict a figure for each of the following . 47. 78.37. $520 ( 5609.15 in today’s dollars). $48,147. 15.1% (46.2 million). 40%. 22%. 92%. Chapter 12 – Gross Domestic Product and Growth.

E N D
Activator – GDP Chapter 12 * Create a chart and predict a figure for each of the following • 47 • 78.37 • $520(5609.15 in today’s dollars) • $48,147 • 15.1% (46.2 million) • 40% • 22% • 92%
Chapter 12 – Gross Domestic Product and Growth Macroeconomics – the study of the behavior and decision making of the economy as a whole. i.e. – inflation, unemployment, and economic growth Gross Domestic Product (GDP) – the total market value of all final goods and services produced within a country’s borders in a given period of time. Measures the economy’s total income Total income = total expenditure
Gross Domestic Product Defined Gross Domestic Product (GDP) (economic growth) – the market dollar value of all final goods and services produced within a country’s borders in a given period of time (nation’s income) “Market Dollar Value…” – total of the market selling prices of goods and services. Price of goods and services “…Of All…” – all items produced in the economy and sold legally in markets. Pears, grapefruit, books, movies, haircuts, etc. “…Final…” – only value of final goods and services (excluding intermediate products). Hallmark card (output), not paper (input) “…Goods and Services…” – Tangible and intangible products food and haircuts, cds and concerts “…Produced…” – only includes new goods and services produced currently. GM sells new car vs. person to person 2nd hand sale “…Within a country…” – only measures production within a country’s borders. Canadian citizen in the U.S., Am. Company in Haiti (not) “… In a given period of time…” – measured within a specific interval of time, usually a year or quarterly (three months)
Components of GDP • Four components: • GDP = C + I + G + NX • Consumption of goods and services by households (Consumer Spending) • Accounts for 70% of GDP • Investments by businesses in goods and services (Business Spending) • Accounts for 15% of GDP • Government goods and services (Government Spending) • Accounts for 20% of GDP • Net exports or imports of goods and services, (Foreign Spending) *Exports (X) – Imports (M)* • Accounts for -5 of GDP Consumption Investment Government Net Exports
Application - Calculating GDP 4000 2400 5000 300 300 9000 250000 400000 300000 -10000 $961,000
Excluded Products from GDP Intermediate products, which are inputs used to produce final goods and services. Second-hand sales - refer to the sales of used goods. Nonmarket Transactions – transactions that do not take place in the marketplace (i.e. fixing your car, mowing your lawn, etc.) Underground Economy (Black Market) – illegal activities, gambling, drugs, prostitution, drug/human smuggling, etc. Cash Transfers – government money sent from taxpayer to entitlement program i.e. Social Security, welfare, unemployment etc.
GDP Poster Project • Poster Requirements: • Title - Gross Domestic Product • Definition of GDP • At least 1 picture to represent each of the components of GDP. • At least 1 picture to represent each of the excluded components of GDP • Label, describe and summarize each picture • Components of GDP: • Consumption • Government • Investment • Net Exports (export and import) • Excluded: • Intermediate products • Second-hand sales • Nonmarket Transactions • Underground Economy • Cash Transfers
Daily Assignment Questions – Page 302 Housing Market – GDP • Important Point: Housing is listed under the Investment category, not Consumption • When was the house counted towards GDP? • Why was it not counted when it was sold this year? • What can be counted towards GDP that was a service provided as a result of the sale of the house? • What were the lumber, nails, shingles, windows and other items used to build your neighbors newly built house categorized as? • What would be added to GDP?
Review – Components of GDP • Indicate the components of GDP that each of the following transactions falls under. • A family buys a new refrigerator. • Ford opens a new plant in Detroit, Michigan. • Glynn County builds a new middle school. • China imports commodities from the United States. • What exclusionary components are affected by the following transactions? • A garage sale in your neighborhood. • The tires, bolts, and engine for a new automobile. • The illegal sale of imitation purses. • Mowing your lawn every other Saturday and being paid an allowance. • Checks sent to Social Security recipients
Nominal Versus Real GDP • Nominal GDP – GDP measured in current prices, not adjusted for inflation. • Real GDP – GDP expressed in constant, unchanging, prices, adjusted for inflation.
Nominal Versus Real GDP • Nominal GDP – GDP measured in current prices, not adjusted for inflation. • Real GDP – GDP expressed in constant, unchanging, prices, adjusted for inflation.
Nominal Versus Real GDP • Nominal GDP – GDP measured in current prices, not adjusted for inflation. • Real GDP – GDP expressed in constant, unchanging, prices, adjusted for inflation.
Nominal Versus Real GDP • Nominal GDP – GDP measured in current prices, not adjusted for inflation. • Real GDP – GDP expressed in constant, unchanging, prices, adjusted for inflation.
Nominal Versus Real GDP • Nominal GDP – GDP measured in current prices, not adjusted for inflation. • Real GDP – GDP expressed in constant, unchanging, prices, adjusted for inflation.
Nominal Versus Real GDP • Nominal GDP – GDP measured in current prices, not adjusted for inflation. • Real GDP – GDP expressed in constant, unchanging, prices, adjusted for inflation.
Nominal Versus Real GDP • Nominal GDP – GDP measured in current prices, not adjusted for inflation. • Real GDP – GDP expressed in constant, unchanging, prices, adjusted for inflation.
Inflation and Inflation Rate • Inflation – inflation is a rise in the general level of prices of goods and services in an economy over a period of time. • Inflation Rate - percentage change in some measure of the price level from one period to the next. • GDP Deflator – an index that converts output measured at current prices into constant-dollar GDP. • The GDP deflator shows inflation, how much a change in the base year's GDP relies upon changes in the price level. • Inflation Rate = GDP Deflator in year 2 – GDP Deflator in year 1 GDP Deflator in year 1
GDP $1 100 $100 $2 50 $100 $2 150 $300 $3 100 $300 $3 200 $600 $4 150 $600 $100 $100 $200 $300 $300 $600 $600 $600 $1200 $1 100 $100 $2 50 $100 $200 $1 150 $150 $2 100 $300 $1 200 $200 $2 150 $100 $100 $200 $150 $200 $350 $200 $300 $500 $200 $200 100 $600 $350 171 240 $1200 $500
Calculating GDP 1.065 107 __14.6 = _______X 100 = _____ 13.7 Calculate the GDP deflator using the following figures: Real GDP 2008 ($13.7 trillion) Nominal GDP 2008 ($14.6 trillion) using the following formula: Nominal GDP X 100 = Real GDP 2. Calculate the nominal GDP for each year, then calculate the GDP deflator for year 2 using year 1 as a base year. Year 1: Apricots - Broccoli - Carrots - Total GDP - Year 2 Real GDP: Apricots - $500 Broccoli - $300 Carrots - $225 Total GDP - $1025 Year 2: Apricots - Broccoli - Carrots - Total GDP - Year 2Nominal: Apricots - $550 Broccoli - $300 Carrots - $270 Total GDP - $1120 __1120 = _______X 100 = _____1025 1.09 109 = 9% inflation Nominal GDP X 100 = Real GDP
Business Cycles • Business Cycle – economy-wide fluctuations in a market or economy over several months or years. • Expansion – period of economic growth as measured by GDP • Peak – When real GDP stops rising • Contraction – economic decline marked by falling real GDP • Rise in unemployment • Trough – “bottomed out”, economy reaches its lowest point, real GDP stops falling • Recovery - A return to a normal state of the economy, where the economy begins to show signs of health "signs of recovery in the housing market“.
Recession • Recession – a prolonged economic contraction • Real GDP falls for two consecutive quarters (6 straight months) • Rise in unemployment, falling profits, bankruptcies, foreclosures, etc. GDP
Depression • A long and severe recession (8 quarters of declining real GDP) • Severely high unemployment and low output
Stagflation • Combines two words, stagnant and inflation, is a decline in real GDP combined with a rise in price level
Four Main Economic Variables • Business Investment – investing in physical capital (plants and equipment) • Interest Rates and Credit – the cost of borrowing, added to the principal investment • Consumer Expectations – fears of a weakening economy can cause consumer confidence to fall, cut back on spending • External Shocks – conditions in society that affect normal economic activity • Oil spill in the gulf, severe drought, hurricanes, etc.
Section 2 Daily Assignment Questions pgs. 312 – 316 • How does businesses investment affect GDP? • What happens when firms cut back on investment spending? • How does reduced investment affect industries that produce capital goods? • What do consumers in the U.S. use credit to purchase; what is the cost of credit? • How do high interest rates affect consumption and business investment? • How did high interest rates affect the economy in 1980? • What happened to unemployment as a result of the recession? • How does a fear of a weakened economy affect spending? • What effect does reduced spending have on the economy? • How was this evident in the spring of 2003? • What happens when consumer confidence rises?
Percentage Change in Real GDP Calculate the percentage change in Real GDP from July 2009 ($13.7 trillion) to March 2010 ($14.2 trillion) using the following formula: New number – Original X 100 = Original 0.0365 3.65% 14.2 – 13.7 = _______X 100 = _______ 13.7 2. Calculate Real Per Capita GDP by using the following formula:Real GDP 2009 Total Pop. 2009*2009 Real GDP – $13,700,000,000,000*2009 Total Pop. – 304,500,000 137000 3.045 = _$44,991_
Economic Growth Economic Growth – sustained increases in an economy’s real GDP Real GDP per capita – real GDP divided by the total population Per Capita – “for each person” Average income for each person in a country Considered the best measure of a nation’s standard of living.
GDP and Quality of Life Nations with higher per capita GDP enjoy higher quality of life, such as: Better Nutrition Comfortable housing Longer life spans Better education Infrastructure/Telecommunications (cable, internet, phone lines, etc.)
Productivity and Economic Growth • Productivity – the amount of goods and services produced for each unit of labor input • High productivity leads to high per capita real GDP = high standard of living • Growth rate - how rapidly real GDP per person grows in a typical year • U.S. real GDP per capita $3,752 in 1870 and $44,260 in 2006; 1.83% growth rate per year
Improving Productivity and Economic Growth Capital deepening – process of increasing the amount of capital per worker (labor productivity) Increase investments in physical capital and human capital
Saving and Investment • Saving and Investment - a society can change the amount of capital it has through S&I • Every dollar saved is a dollar made available for investing • Invest in capital today will raise future productivity tomorrow (capital deepening)
Technological Progress Technological progress – producing more output without using more inputs Technological Knowledge – understanding how to make the best use of available resources
Population and Government Population Growth – can affect productivity and economic growth Ex. India, large population and low productivity, equals low wages and quality of life Ex. United States, consistent population growth, high capital growth, leads to high quality of life Government – government policies can affect a nation’s economic growth Increased taxes, reduces disposable income which takes money away from private investing
Natural Resources • Natural resources - inputs provided by nature that are converted into the production of goods and services • Provided by nature, such as land, rivers, and mineral deposits • U.S. large supply of land and agriculture, Middle East oil supplies • Renewable Resources - are natural resources that can be reproduced. • Forest, wood, paper, energy (wind, solar power), etc. • Nonrenewable Resources - are natural resources that are limited in supply. • Coal, gold, oil, etc.
Essential Question #1 What are the 4 components of GDP? • C – Consumption • I – Investment • G – Government • NX – Net Exports Essential Question #2 • What are the excluded components of GDP? • Intermediate Products • Second-Hand Sales • Non-Market Transactions • Underground Economy (Black Market) • Cash Transfers
Essential Question #3 dollars prices inflation How do you calculate Real GDP and Nominal GDP? • Nominal is calculated using current _________(________), not accounting for_____________ • Real is calculated using a _________ year’s prices (dollars), accounting for__________, keeping price_____________. base inflation constant Essential Question #4 • What are the characteristics of the 4 phases of the business cycle? • Peak – GDP has reached its highest point • Contraction – GDP begins to decline (recession) • Trough – GDP has reached its lowest point • Expansion – GDP begins to rise again
Essential Question #3 What does per capita GDP measure; what does it indicate about a society’s standard of living? • Average income for each person. • Higher the per capita GDP, the higher the standard of living. Essential Question #4 • How can a country improve its standard of living/per capita GDP?? • Productivity, saving and investing, technology, natural resources, population control and stable government
Bananas and Backrubs –Online Quiz 1. Calculate the nominal GDP for each year, then calculate the GDP deflator for each year using year 1 as a base year. Year 1: Bananas - Backrubs - Total GDP - Year 1: Bananas - $5 Backrubs - $30 Total GDP - $35 Year 2: Bananas - Backrubs - Total GDP - Year 2: Bananas - $10 Backrubs - $42 Total GDP - $52 Year 3: Bananas - Backrubs - Total GDP - Year 3: Bananas - $20 Backrubs - $54 Total GDP - $74
VIS Terms Due Tuesday 10 –27 Macroeconomics Gross Domestic Product Nominal GDP Real GDP Expansion Peak Contraction Trough Recession Depression Stagflation
Binder Check Due Tuesday 10-25 Daily Assignment Ch. 12 Sec. 1 Video Questions - Google DAQ’s pg. 302 Ch. 12 Guided Reading Wksht. Population Growth + GDP Wksht. Section 2 DAQ’s pgs. 312-316 Study Guide Chapter 12 C.W. Puzzle Ch. 12 VIS Terms Ch. 12
GDP Country Comparison Use the first table to fill in the information, including population. 1. Describe how population might affect GDP. 2. What does Per Capita GDP tell you about a country's economy and standard of living? 4. Based on the table above, which country has the highest standard of living? The lowest? 5. Why are the citizens of the countries with high Per Capita GDP more likely to have a better quality of life than other countries?
Practice Ch. 12 Consumption No, because that transaction is a cash transfer, not a purchase of currently produced capital goods. It means that imports exceed exports.
Practice Ch. 12 • 100, 200, 400 • 100, 100, 100
Practice Ch. 12 • 700 (1.00 x 200 = 200) + (10.00 x 50 = 500) = 700 • 700 (1.00 x 200 = 200) + (10.00 x 50 = 500) = 700 • 770 (1.00 x 220 = 220) + (11.00 x 50 = 550) = 770 • 720 (1.00 x 220 = 220) + (10.00 x 50 = 500) = 720 • 100 (700/700 x 100 = 100) • 107 (770/720 = 1.069 x 100 = 107) • 107 – 100/100 = .07 x 100 = 7% • 770 – 700/700 = .10 = 10%, Percent increase in prices = 7%, therefore most of the increase was due to prices.
Practice Ch. 12 • Year 1, because the deflator = 100. • Prices rose 20 percent and real output stayed the same. • Prices stayed the same and real output rose 25 percent.
Extra Credit 1. The country of Terrorville produces two goods: footballs and basketballs. The following is a table showing the prices and quantities of output for three years. 2. What percentage of real GDP comes from consumption?
Study Guide Ch. 12 • Macroeconomics • Gross Domestic Product • A system of statistics and accounts that keeps track of production, consumption, saving and investment. • C – spending by consumers I – spending by businesses ,G – spending by government, NX – spending by foreigners, minus imports • “Market Dollar Value…” – market selling prices of goods and services. “…Final goods and services” – only value of final goods and services (excluding intermediate products).“…Within a country’s borders…” – only measures production within a country’s borders. • Intermediate products, which are inputs used to produce final goods and services.Second-hand sales - refer to the sales of used goods.Nonmarket Transactions – transactions that do not take place in the marketplace (i.e. fixing your car, mowing your lawn, etc.)Underground Economy – illegal activities, gambling, drugs, prostitution, smuggling, etc.
Study Guide Ch. 12 • GDP: • Second-hand sale • Government • Investment • Nonmarket Transaction • Underground Economy • Consumption • Net Exports • Intermediate goods