Download
1 / 4
40 likes | 42 Views
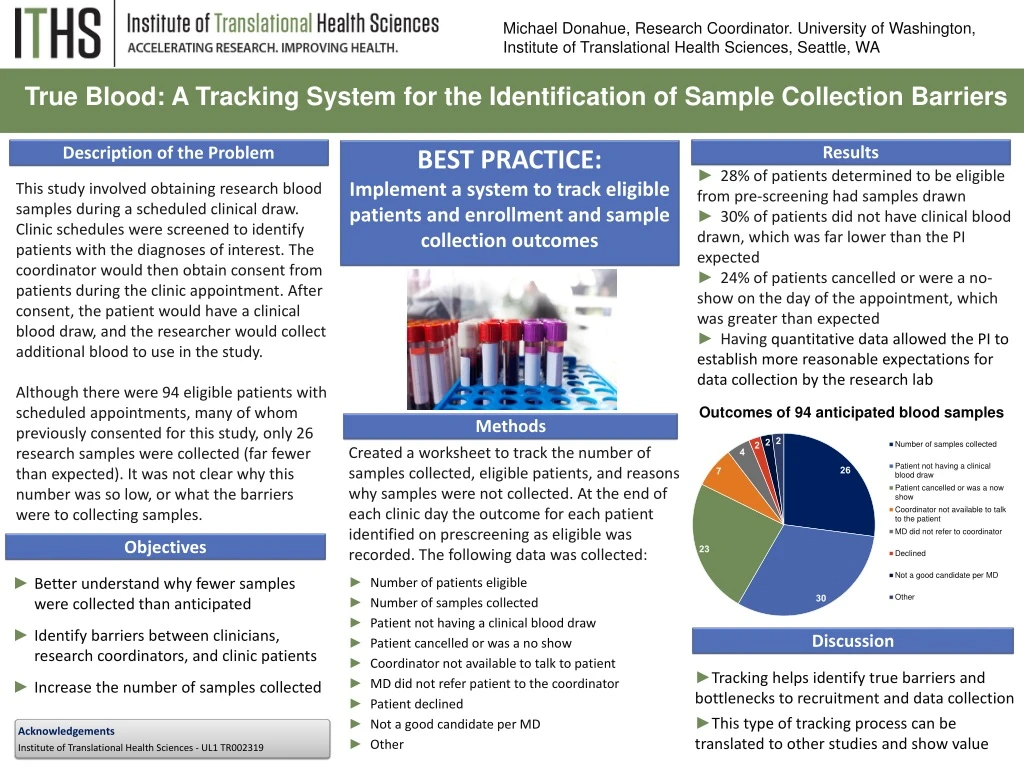
Implement a system to track eligible patients, enrollment, and sample collection outcomes to better understand and overcome barriers to collecting research samples.

E N D
Michael Donahue, Research Coordinator. University of Washington, Institute of Translational Health Sciences, Seattle, WA True Blood: A Tracking System for the Identification of Sample Collection Barriers Results Description of the Problem BEST PRACTICE: Implement a system to track eligible patients and enrollment and sample collection outcomes • 28% of patients determined to be eligible from pre-screening had samples drawn • 30% of patients did not have clinical blood drawn, which was far lower than the PI expected • 24% of patients cancelled or were a no-show on the day of the appointment, which was greater than expected • Having quantitative data allowed the PI to establish more reasonable expectations for data collection by the research lab This study involved obtaining research blood samples during a scheduled clinical draw. Clinic schedules were screened to identify patients with the diagnoses of interest. The coordinator would then obtain consent from patients during the clinic appointment. After consent, the patient would have a clinical blood draw, and the researcher would collect additional blood to use in the study. Although there were 94 eligible patients with scheduled appointments, many of whom previously consented for this study, only 26 research samples were collected (far fewer than expected). It was not clear why this number was so low, or what the barriers were to collecting samples. Outcomes of 94 anticipated blood samples Methods • Created a worksheet to track the number of samples collected, eligible patients, and reasons why samples were not collected. At the end of each clinic day the outcome for each patient identified on prescreening as eligible was recorded. The following data was collected: Objectives • Better understand why fewer samples were collected than anticipated • Identify barriers between clinicians, research coordinators, and clinic patients • Increase the number of samples collected • Number of patients eligible • Number of samples collected • Patient not having a clinical blood draw • Patient cancelled or was a no show • Coordinator not available to talk to patient • MD did not refer patient to the coordinator • Patient declined • Not a good candidate per MD • Other Discussion • Tracking helps identify true barriers and bottlenecks to recruitment and data collection • This type of tracking process can be translated to other studies and show value • Acknowledgements • Institute of Translational Health Sciences - UL1 TR002319
Title: Subtitle Author, Author 1University of Washington, Institute of Translational Health Sciences, Seattle, WA Motivation & Introduction Results Discussion Text Box Text Box Text Box Resources Methods Image/ Diagram • Bullet 1 • Bullet 2 • Bullet 3 • Bullet 4 • Bullet 5 • Bullet 1 • Bullet 2 • Bullet 3 • Bullet 4 • Bullet 5 • Acknowledgements • Institute of Translational Health Sciences - UL1 TR002319 References
Title: Subtitle Key outcome or project statement Text Box • Bullet 1 • Bullet 2 • Bullet 3 • Bullet 4 • Bullet 5 Results Text Box Motivation & Introduction Resources Methods Discussion Image/ Diagram Text Box • Bullet 1 • Bullet 2 • Bullet 3 • Bullet 4 • Bullet 5 • Acknowledgements • Institute of Translational Health Sciences - UL1 TR002319 References
Insert Poster Title HereIn 1 or 2 Lines-80-96 Pt Font Next Steps/Results Need/Problem/ Opportunity Statement Statement of Project HereNo More Than 2-3 Lines60-68 Point Easy-to-Read Font • (Example) Format background and line colors, bullet points, and fonts, and add meaningful graphics or charts to create a unique and interesting poster. Do not reformat the width of the three existing textboxes within the template. They are sized to fit onto the sections of the tri-fold displays when printed and cut. • (Example) Shorten the time from ______________ to _________ so that we can make it easier to_______. • 2 – 4 bullet points in 36 – 44 point font. • Process Improved/ Changes Made • Example) The College of _______ created a web-based application to provide easy access to ________ so faculty and staff spend less time on ________. • Insert a bulleted summary of the results. • (Example) Each side panel should be 11 inches wide. • 2 – 4 bullet points in 36 -44 point font, the same size and font as the other sections. • Future Development • List of other departments, programs, or offices who have already adopted changes or new processes. • A sub title on the line beneath the heading for each section with a date or time reference. • i.e. Summer 2015, or October – December 2015 can be added in a 44 – 54 point font. Project Goals List 3 or 4 Main Goals Size 54 – 66 Point Font Titles Bolded and in Larger FontContactsUniversity of Washington – Organizational Excellencehttp://www.washington.edu/2y2d/oe/orgexcel@uw.edu