Download
1 / 23
250 likes | 647 Views
GLOBALIZATION SINCE THE 1970s. Definitions and Economic Dimensions. Manfred B. Steger Royal Melbourne Institute of Technology Consultant on globalization to U.S. State Department. Globalization

E N D
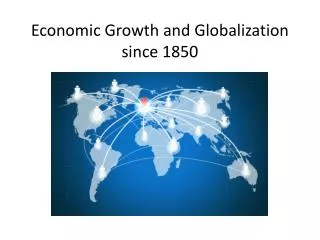
GLOBALIZATION SINCE THE 1970s Definitions and Economic Dimensions
Manfred B. Steger Royal Melbourne Institute of Technology Consultant on globalization to U.S. State Department
Globalization • Marks: “the process by which markets, politics, values, and environmental change are integrated across the globe” (2007: 203) • Steger: “the expansion and intensification of social relations and consciousness across world-time and world-space” (2009: 15)
Different waves or phases Contemporary Marks (Corrected): 3rd. Wave since 1945, 4th. Wave since 1991 (2007: 203-205) Steger: since early 1970s (2009: 36)
Different ideologies or projects • Different “imaginaries” • Market globalism – “globalization from above,” “corporate,” “neoliberal” • Anti-globalization • Justice globalism – “globalization from below” • Jihadist globalism
Multiple dimensions • economic (chapter 3) • political (chapter 4) • cultural (chapter 5) • ecological (chapter 6)
I: What are the main economic characteristics of contemporary globalization? II: How have they come about, and why?
INCREASING CONNECTION • Increasing density, frequency, and speed of cross-border flows of: • Money • Goods • People • Images & ideas
INCREASING POLARIZATION • Increasing: • Poverty and hunger • Inequality • Volatility and insecurity • Concentration of economic power • TNCs • IMF, World Bank, WTO
POVERTY: WORSE THAN PREVIOUSLY THOUGHT “There is a lot more poverty in the world than previously thought. The World Bank reported in August [2008] that in 2005, there were 1.4 billion people living below the poverty line — that is, living on less than $1.25 a day. That is more than a quarter of the developing world’s population and 430 million more people living in extreme poverty than previously estimated. The World Bank warned that the number is unlikely to drop below one billion before 2015.” New York Times, An Even Poorer World, Editorial, Sept. 2, 2008
INCREASING INEQUALITY Share of global income 1965 1970 1980 1990 1997 Richest 20% 69.5% 70.0% 75.4% 83.4% 90.0% Poorest 20% 2.3% 2.2% 1.7% 1.4% 1.0% Source for 1965-90: Roberto P. Korzeniewicz & Timothy P. Moran, 1997, “World Economic Trends in the Distribution of Income, 1965-1992.” American Journal of Sociology 102 (4): 1000-1039; for ‘97, Wayne Elwood, 2001, No Nonsense Guide to Globalization, p. 101.
INCREASING INEQUALITY “The new numbers show global inequality to be significantly greater than even the most pessimistic authors had thought. Until the last month, global inequality, or difference in real incomes between all individuals of the world, was estimated at around 65 Gini points – with 100 denoting complete inequality and 0 denoting total equality, with everybody’s income the same – a level of inequality somewhat higher than that of South Africa. But the new numbers show global inequality to be 70 Gini points – a level of inequality never recorded anywhere.” (emphasis added) Branko Milanovic (Lead Economist in the World Bank research group), Developing Countries Worse Off Than Once Thought, YaleGlobal, February 11, 2008
INCREASING INEQUALITY IN THE UNITED STATES “According to estimates by the economists Thomas Piketty and Emmanuel Saez--confirmed by data from the Congressional Budget Office--between 1973 and 2000 the average real income of the bottom 90 percent of American taxpayers actually fell by 7 percent. Meanwhile, the income of the top 1 percent rose by 148 percent, the income of the top 0.1 percent rose by 343 percent and the income of the top 0.01 percent rose 599 percent. (Those numbers exclude capital gains, so they're not an artifact of the stock-market bubble.) The distribution of income in the United States has gone right back to Gilded Age levels of inequality.” Paul Krugman: The Death of Horatio Alger, The Nation, Jan. 5, 2004
Average Income of Top 0.01% of US Families as Multiple of Bottom 90% of Families The Nation, June 30, 2008
II: How have these changes come about, and why? • Double shift in capitalism since early 1970s: • increasing reach • First World and parts of Third World • entire planet – North and South • shifting character • “controlled” • “free-market” or “neoliberal”
Why have these changes come about? Crisis of controlled capitalism, mid 60s + Econ: falling rate of profit United States Source: Doug Henwood, “The New Economy,” Left Business Observer #106
Dominant responses to crisis – promotion of “market globalism” • Lack of effective challenges until mid-1990s
CONTROLLED CAPITALISM NEOLIBERAL CAPITALISM Mid-1940s to early 1970s Early 1970s to present I: EXPANDING THE REALMS OF PROFIT-MAKING Profit via industry: More emphasis on profit via finance -- agric, manufacturing -- lending to governments (debts) -- lending to consumers -- financial speculation More emphasis on profit via services -- e.g. restaurant chains, fast food outlets, cafes -- global expansion of food services
CONTROLLED CAPITALISM NEOLIBERAL CAPITALISM Mid-1940s to early 1970s Early 1970s to present II: CUTTING THE COSTS OF PRODUCTION National production systems Transnational production Relocating industrial assembly Going “offshore” National labor recruitment Relying more on immigrant labor “In-house” production Outsourcing & subcontracting Stable employment Flexible employment Temporary, short-term
CONTROLLED CAPITALISM NEOLIBERAL CAPITALISM Mid-1940s to early 1970s Early 1970s to present III: EXPANDING CONSUMER DEMAND Mass marketing in First World, Extending demand via global marketing to elites in Third World marketing Intensifying demand, e.g. by speeding up fashion cycles Extending reach of commercial media, advertising
CONTROLLED CAPITALISMNEOLIBERAL CAPITALISM Mid-1940s to early 1970s Early 1970s to present IV: RESTRUCTURING GOVERNANCE -- late 1970s + (Neoliberalism) State as buffer between capital and labor State supporting capital Growing power of IMF, WB, WTO Public ownership of key assets Privatization of key assets Used in public interest Used to make private profit State regulation of capitalist activities Deregulation of capitalist activs.
CONTROLLED CAPITALISMNEOLIBERAL CAPITALISM Mid-1940s to early 1970s Early 1970s to present IV: RESTRUCTURING GOVERNANCE – late 1970s + (Neoliberalism) Social investment by state (& employers) Slashing social safety net -- public administration of services -- privatization of services -- access by right -- access via market Compromises with organized labor Increasing constraints on organized labor
Why have these developments brought • Increasing connection • Increasing polarization?