Download
1 / 55
550 likes | 562 Views
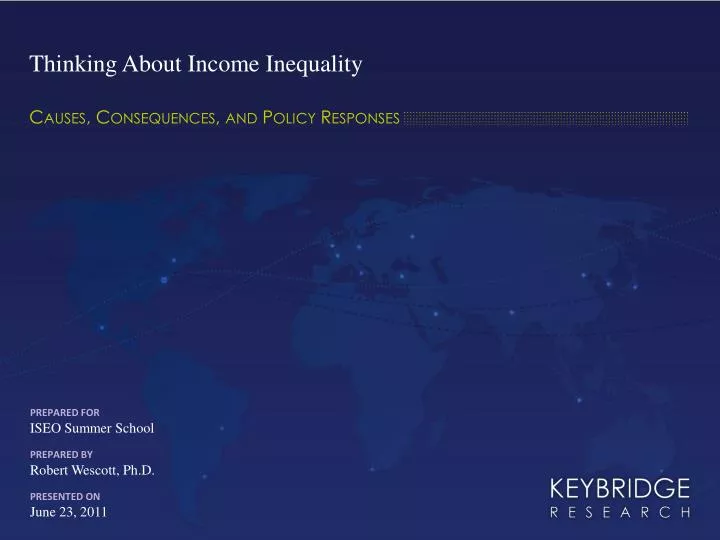
Thinking About Income Inequality. Causes, Consequences, and Policy Responses. Prepared For ISEO Summer School Prepared by Robert Wescott, Ph.D. Presented On June 23, 2011. Historical context: The debate on income inequality dates back to the late 1700s and early 1800s. .

E N D
Thinking About Income Inequality Causes, Consequences, and Policy Responses Prepared For ISEO Summer School Prepared by Robert Wescott, Ph.D. Presented On June 23, 2011
Historical context: The debate on income inequality dates back to the late 1700s and early 1800s. Classical Economists’ Views on Income Inequality Continuing Debates on Income Inequality • Early economic thinkers, including Adam Smith, John Stuart Mill, and David Ricardo, sought to explain the contributions of wealthy people and justify rents and returns to capital. Their basic idea was that people who generated surpluses should be rewarded for their behavior. • Adam Smith, Wealth of Nations: “As soon as capital has accumulated in the hands of particular persons, some of them will naturally employ it in setting to work industrious people, whom they will supply with materials and subsistence, in order to make a profit by the sale of their work, or by what their labour adds to the value of the materials. In exchanging the complete manufacture either for money, for labour, or for other goods, over and above what may be sufficient to pay the price of the materials, and the wages of the workmen, something must be given for the profits of the undertaker of the work who hazards his capital in this adventure.” • David Ricardo, On Protection to Agriculture: “Nothing contributes so much to the prosperity and happiness of a country as high profits.” • In the 1860s, Karl Marx argued in Das Capital that capitalists will always exploit workers. To promote equality, Marx advocated for the abolishment of private land ownership. • In the 1970s, Arthur Okunin Equality vs. Efficiency: The Big Tradeoffidentifies and explains the key tradeoffs in the income inequality debate. • Equality is also widely discussed in politics, sociology, and literature –e.g., Kurt Vonnegut’s satirical short story “Harrison Bergeron” in which the Handicapper General (Diana Moon Glampers) imposes equality by handicapping people with above average intelligence by giving electrical shocks to their brains. • Even today, JahanghirAziz’s views on the role of primary education vs. tertiary education in India fits into the income inequality debate.
Outline for Class • 1) Overview of trends in income inequality in industrial countries • 2) Causes/nature of income inequality • 3) Consequences of income inequality • 4) Discussion of policy options to reduce income inequality • How many social programs can we afford? • What political pressures do governments face? • Are we worried about the sustainability of transfer/spending programs in the fact of growing budget deficit/debt problems around the world? • What policies do YOU recommend for your country?
1) Measuring Income Inequality Source: Nicholson (Dec 2001)
How is income inequality measured and compared across countries? Gini Coefficient The Gini Coefficient (1912) is the standard statistic for measuring income distribution. This score is derived from the Lorenz Curve and based on an equivalent measure of household disposable income (before and after taxes and transfers). Countries are assigned a coefficient between 0 and 1, where “0” represents perfect equality and “1” represents complete inequality. Other Measures of Income Concentration • Another way to measure income inequality is to monitor changes in the income distribution across quintiles or deciles. For example, the 80-20 ratio shows the income share of people in the 80th percentile group compared to the income share of people in the 20th percentile group. Other commonly used income ratios include 90-10; 90-50, 50-10. • Some income inequality measures look at the percent of national income earned by the top 1% or 0.1%. Source: OECD Stat Extracts
When comparing indicators of income inequality across countries, it is important to identify exactly what is being measured. Key Methodological Questions • Does the indicator measure gross income, factor income, or disposable income? • In 2000, Finland’s GiniCoefficients for disposable income, factor income, and initial income were .26, .47, and .31, respectively. • In the U.K., the Gini Coefficient is typically calculated using disposable income, while in the U.S. pretax income is used. • Does the indicator examine the income of families, households, individuals, or taxpayers? • Does the indicator include the self-employed or only wage earners? • What is the data source – survey, census, tax, or social security records? • What kind of inequality is being measured -- income, consumption, etc.? Source: OECD Stat Extracts
Since the mid-1970s, Gini coefficients have increased in many OECD countries (excluding France), suggesting an increase in inequality. * Data for 1985 instead of mid-1970s Source: OECD Stat Extracts GINI Coefficient Comparison From Mid-1970s to Mid-2000s After Taxes & Transfers; “0” represents perfect equality; & “1” represents perfect inequality
Unlike the U.S., income ratios in Sweden have not changed significantly over the past thee decades. Comparison of Income Ratios: U.S. & Sweden Source: Luxembourg Income Survey U.S. Mid-1970s Mid-2000s Sweden
Incomes have grown across many OECD nations, but income of the top 10% earners have increased most rapidly in most countries. Trends in Real Household Income by Decile, Mid-1980s to Late 2000s Source: OECD (May 2011). “Growing Income Inequality in OECD Countries: What Drives it and How Can Policy Tackle It?” Average Annual Change, %
International comparisons of income share by the top 1% reveal that post-1970 there has been a strong surge in U.S. income inequality. Share of Top 1% in Total Income* in Selected Industrial Countries, 1920-2000 * Total income includes labor, business, and capital income; capital gains are excluded. Source: Chart from Gordon, R. & I. Baker (2007). “Selected Issues in the Rise of Income Inequality”. Brookings Papers on Economic Activity, 2. Data from Picketty, T. & E. Saez (2006). “The Evolution of Top Incomes: A Historical and International Perspective”. Working Paper 11955. NBER. Percent of Total Income
And, this same pattern holds for the top 0.1% of income earners. Cross Country Comparison: Share of Nation’s Income* Earned by Top 0.1% * Excludes Capital Gains Source: Chart from Washington Post (June 2011). “(Not) Spreading the Wealth”.
Focus on the U.S.: The top 10% take home roughly the same amount as the total combined income of the rest of the country. Share of U.S. Income* * Includes capital gains. Source: Chart from Washington Post (June 2011). “(Not) Spreading the Wealth”. Post-WWII, the income distribution was relatively more equal than today. As of 2008, the income share of the top 0.1% has grown to 10.4%.
In the first half of the post-war era, cumulative income in the U.S. grew evenly, but patterns have become much less equal since 1974. U.S. Cumulative Income Growth by Income Group Source: Chart from Bartels, L. (2008). Unequal Democracy: The Political Economy of the New Gilded Age. See p. 9. 20th 40th 60th 80th 95th 20th 40th 60th 80th 95th
Who makes up the top 0.1% of American income earners? Source: Chart from Washington Post (June 2011). “(Not) Spreading the Wealth”. Breakdown of Top 0.1% by Profession Based on the Salary, Bonuses, and Stock Options As of 2005, the top 0.1% (140,000 families) made at least $1.7 million (including capital gains). Over 40% of this top group were executives or managers.
Since 1970, executive pay in the U.S. has grown by +430%, while the average wage income has increased by 26%. (Profits are up by less than executive pay!) Source: Chart from Washington Post (June 2011). “(Not) Spreading the Wealth”. Total Change in U.S. Executive Pay Since1970 Percent
What explains the rapid increase in U.S. CEO compensation? Source: Gabaix, X & A. Landier (2006). “Why Has CEO Pay Increased So Much?” MIT Department of Economics Working Paper No. 06-13. Jensen, M. (1993). “The Modern Industrial Revolution Exit, and the Failure of Internal Control Systems”. Journal of Finance 48(3): 831-857. Cadman, B.; Carter, M; Hillegeist, S. (2010). “The Incentives of Compensation Consultants and CEO Pay”. Journal of Accounting and Economics 49: 263-280, Popular Explanations • Marginal productivity theory associates increasing compensation with higher productivity and larger contributions to society. • “CEOs are paid what they are worth to their companies, and their high pay reflects the extraordinary value of their talent.” Greg Mankiw, former economic advisor to President Bush. • “CEOs get paid more because they run bigger, more valuable companies.” James Glassman, American Enterprise Institute. • Gabaix & Landier (2006) argue that the increase in CEO pay between 1980 and 2003 can largely be explained by competitive pressures exerted by the stock market. The authors show that CEO pay has risen in tandem with increases in the market capitalization of large U.S. companies. • In a critique of the Gabaix-Landier hypothesis, Professor Bebchuk of Harvard Law School argues that the lack of transparency on how CEO’s are compensated results in a disconnect between executive pay and productivity. • Jensen (1993) examined the relationship between boards and executives and found that current board culture – which discourages conflict between the board and CEO – may make them less effective at monitoring performance and effectively setting compensation. • Anecdotal evidence suggests that greater reliance on compensation consulting firms has contributed to higher CEO pay. Cadman et. al. (2010) studied this potential conflict of interest and concluded that the presence of these consultants is not a key driver of excessive CEO pay packages.
2) Causes/nature of income inequality. What starts growth? Economic takeoff requires a high saving rate. But does it require large disparities in income? Classical View: Theoretical Link Between Income Inequality & Economic Growth Higher Initial Income Inequality Increased Savings & Capital Accumulation Investment Economic Growth Key Points • The classical view explains that there is a positive relationship between income inequality and economic growth, an argument based on Simon Kuznets’s (1955) inverted-U curve hypothesis, which states that income inequality increases and later decreases in the process of economic development. • Income distribution is a consideration for economic growth in that unequal societies may channel more resources to individuals who have a greater propensity to save. High income earners consume proportionally less of their income and therefore are able to save more relative to low-income earners. • Economic growth is closely tied to the rate at which countries can accumulate productive resources. High concentrations of wealth may lead to faster savings accumulation, which enables greater investment in productive infrastructure and new industries and, in turn, economic growth.
Some more recent theoretical and empirical research finds that income inequality has a negative effect on economic growth. But not the same as “take off”. • Benabou (1996) reviews 23 studies that quantify the effects of income inequality on long-term growth, and finds a negative correlation between income inequality and growth. Specifically, a decline in income inequality by one standard deviation corresponds with a 0.5% to 0.8% increase in per capita GDP. To explain this relationship, academic literature identifies economic, political, and social factors. • Unequal societies that exclude large swaths of people from opportunities to develop their full productive or economic potential could reduce aggregate output and economic growth (Thorbecke& Charmuilind, 2002). • Large inequalities in income, wealth, health, education, and political influence may cause people in the lower income groups to engage in rent-seeking activities, as disenchantment with unequal economic arrangements grows, threatening property rights and, in turn, lowering economic growth (Thorbecke & Charmuilind, 2002). • Murphy, Schliefer & Vishny (1989) explain that high inequality may constrain domestic consumer demand, which would limit potential industrialization and growth. Also, in an unequal society, if the wealthy do not save and invest income – i.e., spend large sums of wealth on luxury goods and non-entrepreneurial activities – then increasing inequality would not increase economic growth. Economic Explanations
Political and social mechanisms may also explain how income inequality affects economic growth. What do class members think about the causes of inequality? • Alesina & Rodrick (1994) explain the consequences of income inequality on economic growth by looking at the effects of inequality on the political system. Based on the median voter theory, they hypothesize that as the disparity between median and mean incomes rise, the median voter begins to push for greater redistribution. Excessive taxation can be economically distortionary and decrease incentives to save and invest. Alesina & Perotti (1993, 1996) predict that high initial inequality of income creates social tension that could trigger political unrest, which negatively impacts investment activity and, in turn, reduces economic growth. • Perotti (1996) finds an empirical link between an expanding middle class (in terms of the proportion of income going to middle income earners) and falling fertility rates. Negative fertility is positively and significantly associated with economic growth. • Burtless & Jencks (2003) suggest that rising economic inequality may result in political inequality as the wealthy gain greater political influence. With this political power, the rich could push for policies that further increase their wealth – e.g., preferential tax treatment. • Galor & Zeira(1993) and Aghion& Bolton (1997) theorize that higher income inequality could inhibit low-income earners from investing in human capital– i.e., educational attainment – which could negatively affect productivity and long-run growth. • Income inequality may also affect growth via public health as poverty can lead to poor nutrition and, in turn, lower worker productivity. Kennedy et. al. (1996) find that in the U.S., income inequality was highly correlated with total mortality rates, controlling for income, poverty, smoking, and race. Burtless & Jencks (2003) conclude that although there is a negative relationship between income inequality and longevity, the effect on economic growth is small. Political & Social Explanations
What does research show? Cross-country studies measuring the impact of income inequality show no consistent effect on economic growth in industrial countries. Source: Chart adapted from Thompson & Leight (April 2011). “Searching for the Supposed Benefits of Higher Inequality: Impacts of Rising Top Shares on the Standard of Living of Low and Middle-Income Families”. Political Economy Research Institute.
Andrew, Jencks, and Leigh (2009) show that reaching conclusions about increasing income inequality is not a straightforward endeavor. Their results are typical! Andrew, D.; C. Jencks, A. Leigh. (2009). “Do Rising Top Incomes Lift All Boats?” Harvard Kennedy School Faculty Research Working Paper Series. • Growth i, p =β1TopShare Income i, t-1 + β2 Income i, t-1 +αi + ηi+ ε i, p • Growth i,p= Average annual per capita growth for country i during period p • TopShareIncome i,t-1 = Measure of income inequality in the year before the growth window opens (t-1) • Incomei,t-1 = Natural logarithm of per capita GDP in the same year • αi + ηi = Vectors of fixed country and year effects • εi, p = Error term • Overview: Using panel data, Andrews, Jencks, and Leigh (2009) test the impact of rising top income shares on economic growth in 12 developed countries. • Results • For period, 1905 to 2000: No robust relationship exists. • For period 1960 to 2000: A 1 point rise in the top 10% income share each year for five years results in an increase in average annual growth by 0.121 percentage points. • Cautionary Note: Measures may overestimate the positive effects of income inequality on growth.
Likewise, empirical evidence on the effects of income distribution on growth in the U.S. is ambiguous. Source: Chart adapted from Thompson & Leight (April 2011). “Searching for the Supposed Benefits of Higher Inequality: Impacts of Rising Top Shares on the Standard of Living of Low and Middle-Income Families”. Political Economy Research Institute.
Another whole aspect of the inequality debate: comparisons of income distribution at a point in time may obscure the positive effects of income mobility on welfare. Income Mobility & Inequality: Hypothesis and Evidence • Hypothesis: If income mobility rises at the same rate as income inequality, then the negative effects of inequality on welfare may be neutralized. Increasing income mobility could create more opportunities for upward mobility, thereby mitigating the effects of higher income inequality (Gordon, 2007). • Empirical Evidence: Bradbury & Katz (2002) examine income mobility transitions over a ten year period in the U.S. They find that people in the upper and lower 20% of the income distribution have a 50% chance of staying in that quintile one decade later. The chance that a person moves from the top to the bottom or visa versa is about 3%. Finally, people in the middle quintiles show quite a bit of mobility in both directions (i.e., churning). Likewise, Gottschalk and Danziger (1997) look at income mobility over a two decade period and identify similar patterns. Source: Gordon, R. & I. Baker (2007). “Selected Issues in the Rise of Income Inequality”. Brookings Papers on Economic Activity, 2.
3) What are the potential consequences of growing income inequality? Social Effects 3 Political Effects 2 Economic Effects 1 Burtless& Jenks (2003): “Citizens … should decide how much economic inequality they are willing to tolerate largely on the basis of what they think is just, not on the basis of its alleged beneficial or adverse effects”.
Thinking about policy options: What factors influence the presence or persistence of income inequality? Supply 1 Demand Institutional 2 3 Political Other Social 4 6 5
How have economists attempted to explain these factors? • Skill-biased technological change (SBTC): • By increasing the relative productivity of skilled labor, SBTC contributes to increasing wage inequality. • While several researchers, including Katz & Murphy (1992) and Bound & Johnson (1992), have offered theoretical evaluations of the SBTC hypothesis, Krueger (1993) quantified this dynamic via the wage effects associated with computerization. • Krueger found that workers who use computers on the job earn about 10-15% more than workers who do not use computers.
How have economists attempted to explain these factors? • Erosion of Labor Market Institutions: • Card et al. (2004) found that 14% of the wage variation across males can be attributed to declining unionization in the U.S. between 1973 and 2001. Across both males and females, the decline of unions explains 10% of the increase in the 90-10 ratio. • Levy & Temin (2007) offer a qualitative explanation for the “Great Compression” – a period of declining inequality in the U.S. from 1940-1970 – which resulted from rising unionization, declining international trade, and declining immigration. • The authors explain that the shift in political philosophy, from the “Detroit Consensus” (strong unionization, etc.) of the late 1940s to the “Washington Consensus” beginning in the early 1980s, largely explains inequality trends in the U.S.
How have economists attempted to explain these factors? • Immigration: • Borjas(2003, 2006) and Borjas& Katz (2005) found that 3% of the decline in the real value of wages of native-born workers can be attributed to rising immigration from 1980 to 2000. • For native-born workers without a high school diploma, immigration reduced real wages by nearly 9%.
How have economists attempted to explain these factors? • Trade: • Feenstra & Hanson (1996) estimated that the increased volume of international trade can explain roughly 20% of the rise in inequality during the 1980s. • They also estimated the effects of international trade on SBTC. For the period 1979-1990, the authors found that outsourcing can explain 15-25% of the shift in demand towards skilled labor and the differences in relative wages between skilled and unskilled labor. • Lawrence (2008) corroborated some of these findings on the effects of trade on inequality in the 1980s, but found that in more recent years trade effects on inequality have declined.
My view on causes of income inequality in a country like the U.S.: • It is a combination of factors: • Institutional factors have played a large role (decline of unionization!) • Skilled-based technical change also played an important role • Immigration has played a noticeable role • Foreign trade has played a fairly small role • But: all forces interact in complex ways! They camouflage each other, reinforce each other. For example, large immigration movement has undermined position of unskilled workers and contributed to reduced power of unions.
4) Policy responses need to take account of tradeoffs between equality and efficiency. Okun (1975) expressed concern over the “leaky bucket”. The Big Tradeoff • Okun presents the concept of the “leaky bucket” – meaning that policies that use tax and transfer measures to shift resources from high-income to low-income earners can impose losses for the economy. Examples, include: • Administrative costs: Dead-weight losses to economy to collect taxes, run transfer programs (accountants, lawyers, government officials, individual time to complete forms). • Work effort: Do the rich choose more leisure time and less work because of higher taxes? (Research generally finds small effects, but libertarians and laissez-faire capitalists always claim it is large. Do they ramp up tax-minimization efforts?) • Saving & Investment: Okun argues that leakage effects from reduced saving/investment are cited most frequently and “confirmed least convincingly”. (Example: 1929, low U.S. taxes, 16% national savings rate; 1973, high 70% marginal U.S. tax rate, 16% national savings rate.) • Socio-economic leakages: Do higher taxes on affluent jeopardize the influence of “rags to riches” dreams? Does receiving transfers harm the self-reliance of the poor or lead to social disenfranchisement? Or, does equalization help broaden participation in the mainstream? Source: Okun, A. (1975). “Equality and Efficiency: The Big Tradeoff”. The Brookings Institution.
Background: U.S. poverty is measured using money income before taxes, and poverty status is determined by dollar amount thresholds. The U.S. Census Bureau’s Dollar Value of Poverty Thresholds by Family Size Census Bureau, “Income, Poverty, and Health Insurance Coverage in the U.S., 2009” (Sept 2010)
What are the main policy responses to income inequality? Policy Options • Taxes and Transfers: Taxes on income, dividends, and capital gains help pay for transfers like food stamps, subsidized insurance. With redistribution, markets operate freely, regardless of the inequality it causes, and then wealth is redistributed ex post, shifting some of the economic gains from those who benefit least in a market-based system. • Promote Educational Attainment: Education is often viewed as the “great equalizer” (Thorbecke & Charumilind, 2002: 1487). Policies that increase access to educational and skills-retraining opportunities may enable people in the lower income brackets to increase their productivity. One reason people may underinvest in education is related to credit market imperfections. Policies aimed at addressing these imperfections could promote educational attainment. • Corporate Governance Structure: Corporate governance rules can also influence income inequality. Might Germany’s social partnership structure be superior to Anglo-Saxon capitalism? In Germany, worker/union representatives must have same number of corporate board seats as management. • Institutional Reforms: laws that are more favorable to the formation and growth of unions.
In the U.S., the marginal tax rate – one way to redistribute – has been steadily declining since 1980. Source: U.S. Congress Joint Economic Committee (Sept 2010). “Income Inequality and the Great Recession”.
Is it possible to tax too much? Arthur Laffer would say, “Yes!” Laffer Curve: Relationship Between Marginal Tax Rates & Tax Revenues
What are Earned Income Tax Credits? Discussion: EITCs Overview • A refundable income tax credit targeted at low-income, working families and individuals. • Enacted in 1975 by President Nixon and expanded during the Clinton Administration. • Encourages work by tying the subsidy to wages. • Works effectively as a wage subsidy. • Considered to be one of the largest anti-poverty programs for working families in the U.S. Design • Provides a wage subsidy based on income and family status. • (1) Must have earned income from employment. • (2) Classified as “low income” – i.e., earned income and adjusted gross income fall within a range. • What is the size of the maximum tax credit? • For tax year 2011: $5,751 (3+ children); $5,112 (2 children); $3,094 (1 child); $464 (no children) Source: Meyer, B. (2010). “The Effects of the Earned Income Tax Credit and Recent Reforms”. National Bureau of Economic Research. Bartels, L. (2008). Unequal Democracy: The Political Economy of the New Gilded Age. Princeton University Press
Are Earned Income Tax Credits an effective policy response? Discussion: EITCs Positive Effects • Targets primarily low-income, single-parent families. The EITC increases the mean income of single-parent household earning between $12,000-$20,000 by about 17% (Meyer, 2010). • As of 2007, EITC payments, totaling close to $50 billion, reached 25 million families. Of these recipients, 4 million individuals were lifted above the poverty line due to the tax credit(Meyer, 2010). • Some transfer programs are accused of undermining work effort, but EITCs transfer income and incentivize work by subsidizing low-wage jobs – i.e., increasing after-tax wages by up to 45% (Meyer, 2010) Critiques • Noncompliance: In an evaluation of EITC claims, the IRS reported that in 1999 about 30% of EITC benefits claimed went to households that should not have qualified for the tax subsidy (Bartels, 2008). • Lack of participation: The Casey Foundation (2005) reports that approximately a quarter of eligible families/individuals fail to claim EITC benefits. Source: Meyer, B. (2010). “The Effects of the Earned Income Tax Credit and Recent Reforms”. National Bureau of Economic Research. Bartels, L. (2008). Unequal Democracy: The Political Economy of the New Gilded Age. Princeton University Press. Casey Foundation (2005). “The Earned Income Tax Credit: Analysis & Proposals for Reform”.
Other U.S. government programs to reduce income inequality. Partial Inventory of Government Programs and Services
Most people generally consider these government services to be important. Opinion Poll: % Saying the Following Government Services are (Very) Important Source: Washing Post-Kaiser-Harvard Poll
Social safety net not only benefits people who are poor, but also many middle income earners. 18% Usage of Government Services Receive unemployment benefits 31% Receive Social Security Payments 35% 31% Are covered by Medicareor Medicaid Receive income tax deductions for interest paid on a home mortgage Source: Washington Post-Kaiser-Harvard Poll
The good news: government programs have greatly reduced poverty among the elderly. But a higher percentage of children and young now live in poverty. Poverty Status of People by Age: 1959 - 2009 Census Bureau, “Income, Poverty, and Health Insurance Coverage in the U.S., 2009” (Sept 2010). Table B2 % of Americans Under 18 Over 65
Another bad problem. Social programs are growing unaffordable in the U.S. People who say the budget can be balanced by cutting non-defense spending may not understand the powerful role of entitlement spending.
Entitlement spending is one of the greatest challenges to bringing down the deficit and controlling national debt. Source: CBO FY 2011 Budget Analysis – Table S-4
U.S.: Except for the Clinton era, spending has always exceeded revenues. Federal Government Outlays and Revenue (Share of GDP) Source: CBO (Jan 2010). The Budget & Economic Outlook: FY 2010 to 2020, Table F-2
But the U.S. federal budget deficit is not on a sustainable track. Deficits are projected to total $8 billion in the next 10 years. Projections
Countries around the world are experiencing high debt levels, constraining their policy options. Net Debt to GDP Ratio, 2009 Source: IMF WEO (April 2009) and Economist (Feb 4, 2010), “A Very European Crisis” Percent
The problem: countries with higher debt burdens have lower per capita GDP growth. Government Debt and Per Capita GDP Growth Source: IMF Staff Estimates
Over the past year, Americans have grown increasingly concerned about the size of government. Source: Gallup Poll Opinion Poll: Perception of the Federal Government’s Power % Saying the Federal Government is: (1) Doing Too Much, (2) The Right Amount, (3) Too Little Too much The right amount Too little
Tea Party supporters want less government involvement than most other Americans, but even they slightly favor government help in fighting poverty. Opinion Poll: % wanting more or the same amount of government involvement Source: Washing Post-Kaiser-Harvard Poll
Most economists believe that if the size of government becomes too large there could be a growth penalty. But at what point? The Size of Government Growth Curve Growth Rate of the Economy Optimum Size of Government Using evidence from a sample of OECD countries, Chobanov & Mladenova (2009) found that when government spending is kept to 25% (+/-5%) of GDP countries tend to maximize their economic growth potential. Size of Government (% of GDP)