1 / 24

Chapter 2 Semiconductor Materials and Process Chemicals

Chapter 2 Semiconductor Materials and Process Chemicals. 半導體製程 材料科學與工程研究所 張翼 教授. Figure 2.1 Bohr atom model. Figure 2.2 Periodic table of elements. Figure 2.3 Atomic structures of hydrogen, lithium, and sodium. Figure 2.4 The three best electrical conductors.

giona
Download Presentation

Chapter 2 Semiconductor Materials and Process Chemicals

An Image/Link below is provided (as is) to download presentation Download Policy: Content on the Website is provided to you AS IS for your information and personal use and may not be sold / licensed / shared on other websites without getting consent from its author. Content is provided to you AS IS for your information and personal use only. Download presentation by click this link. While downloading, if for some reason you are not able to download a presentation, the publisher may have deleted the file from their server. During download, if you can't get a presentation, the file might be deleted by the publisher.

E N D

Presentation Transcript


  1. Chapter 2Semiconductor Materials and Process Chemicals 半導體製程 材料科學與工程研究所 張翼 教授

  2. Figure 2.1 Bohr atom model.

  3. Figure 2.2 Periodic table of elements.

  4. Figure 2.3 Atomic structures of hydrogen, lithium, and sodium.

  5. Figure 2.4 The three best electrical conductors.

  6. Figure 2.5 Resistance of rectangular bar.

  7. Figure 2.6 Semiconductor materials.

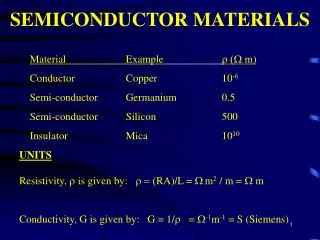
  8. Figure 2.7 Silicon resistivity versus doping (carrier) concentration. (After Thurber et al. Natl. Bur Standards Spec. Publ. 400-64, May 1981, tables 10 and 14.)

  9. Figure 2.8 N-type doping of silicon with arsenic.

  10. Figure 2.9 P-type doping of silicon with boron.

  11. Figure 2.10 Electron conduction in N-type semiconductor material.

  12. Figure 2.11 Hole conduction in P-type semiconductor material.

  13. Figure 2.12 Electrical classification of materials.

  14. Figure 2.13 Characteristics of doped semiconductors.

  15. Figure 2.14 Physical properties of semiconductor materials.

  16. Figure 2.15 Diagram of wafer molecule.

  17. Figure 2.16 Four states of nature.

  18. Figure 2.17 Temperature scales.

  19. Figure 2.18 Pressure vacuum measurement.

  20. Figure 2.19 Acid and base solutions.

  21. Figure 2.20 pH scale.

  22. Si (S) + 3HCl (g) → SiH Cl3 (e) + H2 SiO2 + C → Si + CO2 Purity Grade 98% 1500 - 2000℃ Si (S) + 3HCl (g) → SiH Cl3 (e) + H2 SiHCl3 + H2 → Si + 3HCl Purity Grade 99.999999999%

  23. Silicon purification reactions • SiO2 + C → Si + CO2 Purity Grade 98% • 1500 - 2000℃ • Si (S) + 3HCl (g) → SiH Cl3 (g) + H2 • SiHCl3 + H2 → Si + 3HCl • Purity Grade 99.999999999%

  24. Wafer cutting and polishing from the ingot

More Related