Download

1 / 56
560 likes | 664 Views
Population, language, ethnicity and socio-economic aspects of education. Michelle vonAhn, Ruth Lupton and Dick Wiggins. School pupils with a first language other than English (Jan 2009). A big issue in London. Who is interested?. Businesses

E N D
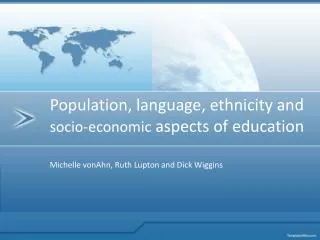
Population, language, ethnicity and socio-economic aspects of education Michelle vonAhn, Ruth Lupton and Dick Wiggins
School pupils with a first language other than English (Jan 2009)
Who is interested? Businesses Have we got the language skills to talk to the rest of the world, and where are they? Public services Are there people who need translation or language classes – where are they? How we can we find employees who speak the languages we need? Government Does language diversity help or hinder community cohesion? Olympic organisers! Schools Is a different first language an asset or a liability? Little evidence, tendency to treat all ‘bi-linguals’ the same
And beyond language… Can knowing about language tell us more about people’s migration history and social and economic status than the crude ethnic categories we have available?
Aims of the fellowship Analyse and map distribution of language across London What issues does this raise? Analyse the relationship between language, ethnicity and socio-economic indicators Conduct some preliminary analysis between language and attainment Provide guidance and training on the ways language data may be used with other data to answer social and educational research questions
Updating Multilingual Capital Published in 2000, using pupil data from 1999 to identify and map languages in London
Pupil data But data collection variability makes comparison difficult…
Data inconsistency Some languages have variants, which are not consistently used within a local authority or across London, e.g.
Geography • Comparative counts not possible with boroughs due to differences in size • Wards and postcodes also differ in population size • Percentage comparisons are problematic due to data capture variability • New statistical geographies - Super Output Areas
And now… t he maps….
Bengali London = 46,681
Urdu London = 29,354
Panjabi London = 20,998 London = 20,998
Gujarati London = 19,572
Tamil London = 16,386
Persian/Farsi London = 6,959
Chinese London = 5,905
Migration patterns over time Annual data could show change (if data is collected in a robust way) Established communities Recent arrivals Magnet communities
Somali London = 27,126
Somali numbers have increased, but their distribution has also become more dispersed
Turkish London = 16,778
Greek London = 3,336
Polish London = 11,035
Lithuanian London = 2,974
Language is not always enough French speakers 17% White 57% Black 26% Other Arabic speakers 57% Other 15% Black 10% Mixed 9% White 8% Asian
French by ethnic group London = 13,020
Portuguese by ethnic group London = 11,915
Portuguese also has a different geographic distribution for Black and White ethnic groups.
Spanish by ethnic group London = 8,647
White Spanish speakers are likely to be from Europe, while Other Spanish are probably from Central and Latin America
Proof of concept study: first stage How are ethnicity and language related? Can we create useful ethnicity/language categories? How is language related to attainment? Does ethnicity/ language tell us more than ethnicity on its own?
Linguistic Breakdown for Selected Lower Attaining Groups Bangladeshi Black ‘other’
Linguistic Breakdown for Selected Lower Attaining Groups Black African White ‘other’
Diversity in the ‘Black African’ group • Higher attaining Lower attaining
Yoruba London = 13,961
Igbo London = 2,837
Akan/Twi/Fante London = 8,117