Download
1 / 51
510 likes | 661 Views
LGM-Dairy: A Wisconsin Example. LGM-Dairy: A New Risk Management Tool (Workshop Section II). Overview of Workshop Section II. Review a hypothetical dairy farm example Farm characteristics LGM-Dairy contract characteristics Overview of Behind the Scenes calculations

E N D
LGM-Dairy: A Wisconsin Example LGM-Dairy: A New Risk Management Tool (Workshop Section II)
Overview of Workshop Section II • Review a hypothetical dairy farm example • Farm characteristics • LGM-Dairy contract characteristics • Overview of Behind the Scenes calculations • Expected milk and feed prices • How your premiums are determined • Comparison of use of options vs. LGM-Dairy • Review premium calculation software and analysis • UW LGM-Dairy premium calculators
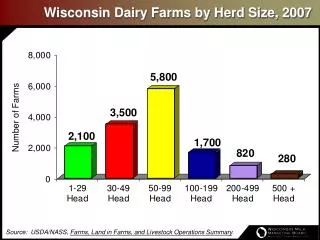
LGM-Dairy: Wisconsin Example • Farm characteristics • 250 milk cows • Average per cow productivity: 19,769 lbs • WI 200-499+ herd size category average →
LGM-Dairy: Wisconsin Example • Insurance contract purchased on February 25th 3rd to last business day Last Business Day Insurance Purchase Day
LGM-Dairy: Wisconsin Example • Feb. Purchase Date → Possible 10-Month Coverage Period: Apr. 2009 – Jan. 2010 • Cow productivity changes by month • Based on Wisconsin monthly yield profile • Expected Feed Use • 966 Tons Corn Equivalent • 213 Tons SBM Equivalent • We assume producer insures 100% of expected production
LGM-Dairy: Wisconsin Example (Feb. 09 Contract)
Calculation of Expected Prices • With Feb 25th insurance purchase date • Expected Price Measurement (EPM) period: Feb. 23st, 24th and 25th • To determine the Gross Margin Guarantee at contract sign-up we need: • Expected monthly milk and feed prices • Producer elected deductible
LGM-Dairy: Wisconsin Example • Insurance contract purchased on February 25th Average Settle Prices Over These Days for Expected Prices Purchase Day 3rd to last business day
Calculation of Expected Prices • Monthly expected prices for Apr`09–Jan`10 • Expected Wisconsin All Milk price = Expected Class III prices + Wisconsin [All-Milk – Class III] Basis • Expected Wisconsin Corn Grain price = Expected Corn prices + Wisconsin [Corn Price Received – Corn Futures] Basis • Expected U.S. Soybean Meal prices (no local basis)
Calculation of Expected All-Milk Prices • The program uses the EPM period’s Class III futures settle prices to determine expected Class III prices • Feb. 23rd, 24th and 25th • There are Class III futures contracts traded for each month
Calculation of Expected All-Milk Price Contract Months Note: [4] = ([1] + [2] + [3])/3 [6] = [4] + [5] [4] are rounded values
Calculation of Expected Gross Revenue • With estimation of 10 expected Wisconsin All-Milk price values one knows • Expected Gross Revenue (EGR) at sign-up • EGR is the product of expected All-Milk price times covered milk production • Covered production could be less than allowable target as elected by the producer • Different price and covered production each month
Calculation of Expected Gross Revenue Note: [ 1] obtained from previous table [3] = [1] * [2]
Calculation of Expected Feed Prices • Like Class III, EPM period’s futures settle prices used in calculation of expected corn and SBM prices • Fed. 23rd, 24th and 25th • Calculate expected prices for each month of contract • Unlike Class III contracts, corn/soybean meal futures contracts do not exist for every month
Calculation of Expected Corn Price Contract Months Note: [4] = ([1]+[2]+[3])/3, [5] = weighted average, [7] = [5]+[6]
Calculation of Expected Corn Costs • With calculated monthly expected corn • Multiply each months covered corn equivalents times the expected price to estimate expected corn costs • Covered corn equivalents is equal to total corn equivalents multiplied by % of production covered
Calculation of Expected Corn Cost Note: [1] obtained from previous table[5] = [4]*(2000/56)* [3]
Calculation of Expected SBM Costs • Similar procedure is used to estimate SBM costs • Use same EPM period to obtain SBM futures settle prices • No basis added
Calculation of Expected SBM Price Contract Months Note: [4] = ( [1] + [2] + [3] )/3 [5] = average of preceding and following value of [4] if no futures contract, [4] otherwise
Calculation of Expected SBM Cost Note: [3] = [1]* [2]
Calculation of Gross Margin Guarantee • Expected Gross Margin = EGR–EFC • Gross Margin Guarantee (GMG) • GMG = Expected Total (Over Entire Contract) Gross Margin – [Deductible x Total Covered Milk Marketings] Expected Feed Costs Expected Gross Revenue
Calculation of Gross Margin Guarantee • Summary of Enrollment Data: • Expected Milk and Feed Prices • Calculated by RMA from Futures Market • Statement of Insured Marketings • Monthly Target Marketings • Desired Coverage % • Statement of Expected Feed Use • Deductible ($ GMG/cwt):
Calculation of Gross Margin Guarantee Note: [4] = [1] – [2] – [3], $1.00 GMG/cwt deductible assumed
Calculation of Insurance Premiums • As noted in Section I of this workshop, there is NoProducer Premium Subsidy • For each of 5,000 simulations • RMA simulates Class III, corn grain and SBM prices using data obtained from the EPMperiod • Generate simulated total gross margins • Determine insurance payout where Insurance Payout = Max(0, Total GMG – SimulatedTotal Gross Margin Guarantee) • Premiums = Average of Simulated Payouts + 3%
Calculation of Insurance Premiums • For each simulated price scenario the simulated prices are generated following historical correlations between Class III, Corn and SBM • For example, when simulating a high corn price a high SBM price is likely to be obtained
Calculation of Insurance Premiums • The Understanding Dairy Markets website maintains a database of 5,000 simulated price scenarios • Aug. 2008-Present actual RMA premium data • Prior to Aug. 2008 we generated our own price scenarios • Evaluate hypothetical premiums • Alternative market conditions
Calculation of Insurance Premiums • USDA (RMA) Premium Calculator Website: http://www3.rma.usda.gov/apps/premcalc/ • Understanding Dairy Markets Premium Calculator: http://future.aae.wisc.edu/lgm_dairy.html#2 • Automatically evaluate program performance with $0 - $1.50/cwt deductibles • Total and per cwt premiums • Premium as % of GMG • Probability of simulated payouts • We will review this software later • Available for download and on your workshop CD
Calculation of Insurance Premiums http://future.aae.wisc.edu/lgm_dairy.html#2 Actual premium data
Calculation of Insurance Premiums • February 2009 example: • Impact of increasing deductibles • Premiums Decrease • GMG Decrease • Premiums Decrease at a Faster Rate than GMG • Relative Decrease of the Above Depends On • Price Volatility at Sign-Up • Expected Gross Margins at Sign-Up • Payout Probability Decreases with Higher Deductibles
Insurance Premiums and Deductible Level (Feb. ′09 Example) Note: % ↓ measured from $0 Deductible level
Relative GMG and Insurance Premiums (Feb. ′09 Example)
Relative Premium Value and Deductible (Feb. ′09 Example)
Determining Actual Indemnities • Actual Prices Determined as Futures Expire • Average Futures Settle Prices From 1st, 2nd, and 3rd days priorto last trading day • Actual Gross Margin (AGM) = Actual Revenue – Actual Feed Costs • Actual Prices: State Average NOT Farm Price • LGM-Dairy Actual Indemnity: • Actual Indemnity = Max[0, Total GMG – Total AGM] • Total Refers to Sum Over All Months
Determining Actual Indemnities • As an example: July 2009 actual grain prices • By rule, corn and SBM futures stop trading on last business day prior to 15th of the futures month • July ‘09 corn/SBM last trading day: July 14th • Actual price measurement period • July ‘09: July 9th, 10th, and 13th
Determining Actual Indemnities Actual Corn/SBM Price Measurement Period Corn/SBM Last Trading Day Actual Class III Price Measurement Period Last Class III Futures Trading Day Class III Announced
Cost Comparison of LGM-Dairy With Options-Based Revenue Management • LGM-Dairy similar to a bundled option • How does LGM-Dairy compare to costs of setting a RevenueFloor via Class III puts and Corn/SBM calls? • For Comparison Example • We assume options perfectly divisible • Compare costs under variety of deductibles • We use January 2008 data • Availability of actual 10-month price data
A Cost Comparison of LGM-Dairy With Options-Based Revenue Management • Expected prices for Jan. 2008 LGM-Dairy purchase
A Cost Comparison of LGM-Dairy With Options-Based Revenue Management • Puts and Calls on January 29, 2008 Note: The values in green correspond to the following months options given that options are not available for these months
A Cost Comparison of LGM-Dairy With Options-Based Revenue Management • Gross options costs Cost of LGM-Dairy, $0 Deductible: $36,107 Total Gross Cost of Puts/Calls: $63,216
Cost Comparison of LGM-Dairy With Options-Based Revenue Management • We can compare the net costs of the two programs
A Cost Comparison of LGM-Dairy With Options-Based Revenue Management • We can compare the net costs of the two programs Note: For options, the Net value represents the costs after subtracting the option value from the initial premiums and then multiplying by the amount purchased. For LGM-Dairy net cost is the calculated as premium costs minus indemnity paid. For the January 2008 contract as specified, there would not have been any indemnities paid.
A Cost Comparison of LGM-Dairy With Options-Based Revenue Management • We can compare the net costs of the two programs Note: Under the options based strategy we reduce the options costs by the % reduction in GMG observed under the LGM-Dairy scenarios.
UW LGM-Dairy Premium Calculators • To complement RMA’s website, we developed software systems for estimating premiums: • We have 2 versions • Based on historical data • Use of current (previous 3 days) futures and options to estimate future likely premiums • Historical System: “What if” I had purchase an LGM-Dairy contract 3 months ago? • On-Demand System: What will be my premium if I purchase a contract at the end of this month?
UW LGM-Dairy Premium Calculators • Historical Calculator • Contains a database of actual premium information since August, 2008 • Contains a database for premium calculation prior to Aug. ′08: Jan. ′00 –July ′08 • Impacts under alternative market conditions • Can be used for what-if type of analysis • “What if I had purchased insurance during Oct?” • “How sensitive would my premiums have been to changes in deductible?”
UW LGM-Dairy Premium Calculators • University of WisconsinHistorical Premium Calculator: http://future.aae.wisc.edu/lgm_dairy.html#2 • Automatically Evaluates the Impacts of $0 - $1.50/cwt Deductibles • Total and Per CWT Premiums • Premium as % of GMG • Probability of Simulated Payouts
UW LGM-Dairy Premium Calculators • UW LGM-Dairy Historical Premium Calculator can be found on the Understanding Dairy Markets website http://future.aae.wisc.edu/lgm_dairy.html#2
UW LGM-Dairy Premium Calculators • LGM-Dairy Premium Calculator Input Page Select your state Select month for analysis Enter % coverage Choose deductible Insert target marketings and feed equivalents
UW LGM-Dairy Premium Calculators • What kind of analyses are automatically displayed?
UW LGM-Dairy Premium Calculators • What kind of analyses are automatically displayed?
Automatic Validation of Feed Equivalents • To determine if are within allowable feeding ranges: • UW premium calculator automatically checks your feeding regime to determine if it falls within the desired range • Alternatively, you can access the standalone feed conversion software • Spreadsheet version • Web-based version http://future.aae.wisc.edu/lgm-dairy/excel_files/feed_conversions_2.xls http://future.aae.wisc.edu/conversion/grains