Download
1 / 17
170 likes | 301 Views
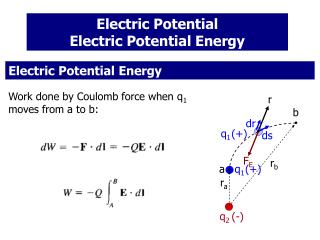
Measuring the electric potential at the bow shock. Group A: Tutor: S. Bale Crew: L. Xie L. Yang B. Engavale W.-L. Teh W.-L. Shi X.-G. Zhang. Introduction Data and Analysis Techniques Present result Work to be done.

E N D
Measuring the electric potential at the bow shock Group A: Tutor: S. Bale Crew: L. Xie L. Yang B. Engavale W.-L. Teh W.-L. Shi X.-G. Zhang
Introduction Data and Analysis Techniques Present result Work to be done Outlines
transition region from supersonic upstream flow to subsonic downstream flow. Density, temperature and fields changes rapidly Shocks can be found everywhere, near the planets, stars, etc. Bow shock
Magnetosheath Bow shock Solar wind ? Purpose of our project is to estimate potential energy in the bow shock region.
Energy distribution is earlier studied by J.D. Scudder(1986,1995), but it is not yet understood very clearly. Very few measurements of potential at the bow shock are available. Investigate the role of potential in the energy distribution and its dependence on solar wind properties(M, ,)
Data And Analysis Techniques Data Description • Magnetic Fields (FGM) • Electric Fields (EFW) • Plasma density (CIS) • Plasma velocity (CIS) FGM
Some physical quantities, namely, B fields, plasma density, plasma velocity, will change rapidly when traversing the shock. Analysis Methods 1. Shock identification Cluster measures electric fields only in two directions, we want to compute the third component of E field by using this equation.
One crossing of the shock • 2001 Mar 31 • Assumptions: • Quasi-perpendicular shock • One-dimensional structure of shock • Steady state
n=[0.94,-0.2,0.28] 2. Shock Normal Estimate Use crossing times approach to estimate the shock normal in our study. Method description: v n rij where
3. Coordinates transformation Normal Incidence Frame In this frame, the flow will be directed along the shock normal. Maximum variance analysis of electric field (MVAE) < > denotes the average
4. Electric potential calculation Min Int Max After transforming the electric fields into the variance space, we integrate the maximum variance of the electric field, which is the normal electric component of the shock, to obtain the electric potential across the shock layer. The estimate of the start time and end time becomes very important in this calculations of electric potential. Vup=670km/s, Vdn=263km/s, E=1974eV
Present result Analyzed 8 shocks (21 Mar 2001) as a function of Mach number. In order to study this further, we need to study more cases.
Cluster data available ⇒ 3 years(2000-2003) ∼100 orbits 200 to 2000 shocks By assuming each event analysis take 30 min 6 person (8 hrs/day) ⇒ 1 months Work to be done back
GROUP_A GROUP_B GROUP_C Data analysis + programming PROJECT New interesting results, Need detailed analysis Meeting for the discussion Few months
LOOKING FORWARD FOR THIS PROJECT THANKS FOR YOUR ATTENTIONS !