Download
1 / 16
160 likes | 383 Views
Poverty and Gender: Initial Findings PSE 2012. Esther Dermott Christina Pantazis University of Bristol Esther.Dermott@bristol.ac.uk C.Pantazis@bristol.ac.uk. Third Peter Townsend Memorial Conference Poverty and Social Exclusion in the UK. Overview. Gender and Poverty

E N D
Poverty and Gender:Initial Findings PSE 2012 Esther Dermott Christina Pantazis University of Bristol Esther.Dermott@bristol.ac.uk C.Pantazis@bristol.ac.uk Third Peter Townsend Memorial Conference Poverty and Social Exclusion in the UK
Overview • Gender and Poverty • Economic and Political Context • Data Analysis • PSE poverty • Deprivation scores • Subjective poverty • Change over time • Multivariate analysis • Conclusions
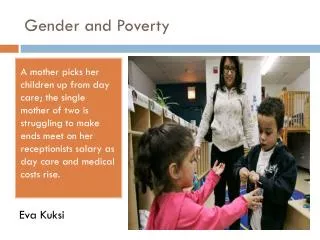
Gender and Poverty Feminisation of poverty Focus on lone parents and older single women (e.g. Goldberg et al.2010) Lack of attention to men and couple+ households Previous research Poverty rates – women have slightly higher level than men Experience of poverty – women more likely to go without Bennett, F. and Daly, M. (2014) Poverty Through a Gender Lens. Joseph Rowntree Foundation “A focus on gender is long overdue in anti-poverty strategies in the UK” p13
Economic and Political Context • Recession - ‘Mancession’? Loss of male jobs / rise in male unemployment Construction and manufacturing initially hardest hit • Austerity - ‘Womancession’? Loss of female public sector jobs / rise in female unemployment Public sector pay freeze Cuts in public services • Welfare Reform Wide-ranging cuts - including freezing of child benefits, reduced eligibility for child tax credit and working tax credit, reduction in childcare element of Working Tax Credit, cap to housing benefit. Increased eligibility childcare support for parents and extended nursery provision
Headline Findings • Women are marginally poorer and more deprived than men • Women economise more than men • Looking at the broad categories of men and women disguises the extent of within group differences • Over the last decade the gendered pattern of poverty has declined • The situation of older women has improved; the position of male single adults has declined.
Poverty • Women are marginally poorer than men • PSE Poverty Men 20% Women 22% • Income Poverty Men 25% Women 26% • Subjective Poverty Men 33% Women 36% (always & sometimes feel poor)
PSE Poverty and Gender: significance of age Percentage of women and men experiencing poverty (PSE measure) by age group
PSE Poverty and Gender: significance of household composition Percentage of women and men experiencing poverty (PSE measure) by household composition
Deprivation Thresholds • Looking at consensually agreed necessities, women are slightly more likely to experience deprivation (2.1 compared to 1.9 items) • The gender gap narrows as deprivation increases Percentage of women and men lacking necessities due to affordability
Deprivation Thresholds • Significance of age and household composition • For men and women deprivation is similar for all age groups from 16 up to 54, and then decreases • The oldest age groups have the lowest levels of deprivation (among men and women) • Women in lone parent households have the highest levels of deprivation averaging 5 (compared to 2.1 for all women) • Men in single adult households have the second highest level of deprivation averaging 2.9 (compared to 1.9 for all men)
Economising Behaviour Percentage of women and men who had economised on items to keep living costs down in the previous year
Economising • The gender gap in economising behaviour emerges largely among the non-poor Percentage of women and men who had economised on items to keep living costs down in the previous year
Changes Over Time – Older Women • PSE poverty rates for older women have improved 2012 13% of 65-74 and 9% of 75+ were poor 1999 21% in 65-74 and 28% of 75+ were poor • Deprivation scores for older women have improved • 1.1 for 65-74 and 0.7 of 75+ 1999 1.5 for 65-74 and 1.6 for 75+
Changes Over Time – Single Men • Single adult men have emerged as a poor group • PSE poverty 2012 31% 1999 27% • Deprivation scores 2012 2.9 1999 1.7 • Subjective poverty 2012 16% 1999 7%
Multivariate Analysis • Poor general health is associated with higher levels of poverty (men & women) • Working full-time is associated with lower levels of poverty (men & women) • Being younger is associated with higher levels of poverty (men) • Being younger or middle-aged is associated with higher levels of poverty (women) • Living in a single adult household or in a couple with children is associated with higher levels of poverty (men) • Living in a lone parent family or in couple with children is associated with higher levels of poverty (women) • Having a non-resident child is associated with higher levels of poverty (men)
Conclusions • Women are marginally poorer and more deprived than men • Women economise more than men • Looking at the broad categories of men and women disguises the extent of within group differences • Over the last decade the gendered pattern of poverty has declined • The situation of older women has improved; the position of male single adults has declined.