Download
1 / 34
340 likes | 343 Views
This presentation explores the relationship between wellness and academic performance among two first-year cohorts in college. It discusses the impact of risky health behaviors on the success of these cohorts and emphasizes the importance of using research to keep first-year students in school.

E N D
Keene State College – New Hampshire Marj Droppa, PhD Dick Jardine, PhD Investigating Wellness Status & GPA among Two First-Year Cohorts ACHA Annual Conference 2013
Session Objectives Objective 1 • Relationship between wellness & academics Objective 2 • Impact of risky health behavior on success of first-year cohorts Objective 3 • Using research to keep our first-years in school
Objective 1 • Relationship between Wellness and Academic Performance
Cost to the student Dropout
Health-related Academic Impediments • Stress – 29% • Sleep – 20% • Anxiety – 19% • Cold/flu – 14% 7. Depression – 11.3%
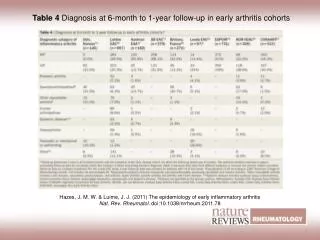
4-year study • 2 first-year cohorts • Entry – Graduation • Race/ethnicity
College Population is Unique • By 2017: 20 million college students • First generation • Female • Black, Hispanic, Asian • Veterans • Disabilities
COLLEGE WELLNESS SURVEY Sexual Wellness Emotional Wellness Physical Wellness Drug/Alcohol Wellness
Student Scores • Overall Wellness Score • Score in each Wellness Dimension • Drugs/Alcohol • Sexual Wellness • Emotional Wellness • Physical Wellness
Objective 2 • Impact of risky health behavior on first-year academic performance
Difference in GPA from first-second year was not significant
MEAN WELLNESS SCORE Sophomores at KSC were less well than in their 1st year
Significance testing of difference in mean wellness scores Hypothesis test results:μ1k : mean of KSC 1st μ2k : mean of KSC 2nd μ1k - μ2k : mean difference H0 : μ1k - μ2k = 0 HA : μ1k - μ2k ≠ 0 Hypothesis test results:μ1T : mean of TAMU 1st μ2T : mean of TAMU 2nd μ1T - μ2T : mean difference H0 : μ1T - μ2T = 0 HA : μ1T - μ2T ≠ 0 CONCLUSION: KSC students’ wellness score worsened from first to the second year, and the difference is statistically significant. CAVEAT: Data distribution skewed, not a probability sample, groups not independent
Numerical summary of Wellness Survey scores • KSC students’ wellness scores dropped across all dimensions • Which wellness dimension had significant effect on GPA?
Logistic Regression Analysis • Logistic regression analyzes relationships between dichotomous response variable (e.g., higher and lower GPA) and categorical or quantitative explanatory variables (e.g., Wellness Score) • Combines the explanatory variables to determine the probability that the response variable would occur • Logistic regression requires no assumptions of normality or of similar variability in the explanatory variables • Applied Logistic Analysis Hosmer, Lemeshow and Sturdivant
Logistic Regression Analysis Logistic regression resultsDependent Variable: High GPA Independent Variable(s): Weighted Wellness Score Parameter estimates
Logistic Regression Analysis • Conclusion: Student GPA performance most significantly influenced by their propensity to smoke cigarettes.
TAMU-CC Cohort Demographics, GPA, and Wellness
TAMU-CC Demographic Statistics • While women claimed to have higher GPA, their wellness score was lower than their male counterparts
TAMU-CC Demographic Statistics • Students who reported as Asian or multiracial had higher Wellness scores and reported higher GPA • If resource constrained, intervention should be targeted on the Hispanic and White student groups
Objective 3 • Using research to keep our first-year students in school
Poster Activity Questions • Freshmen programming focus? • If use our analysis, what would you have to change on your campus? • Please share SOPHOMORES Drugs & Alcohol Smokers
What is Next • 2 more years of First-Year Cohorts study • New Wellness Survey • New Collaborations
Would you like to collaborate? Marj Droppa, PhD Keene State College, New Hampshire Email: mdroppa@keene.edu