Download
1 / 29
290 likes | 300 Views
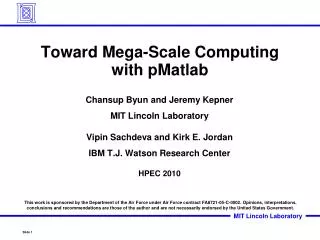
Toward Mega-Scale Computing with pMatlab. Chansup Byun and Jeremy Kepner MIT Lincoln Laboratory Vipin Sachdeva and Kirk E. Jordan IBM T.J. Watson Research Center HPEC 2010.

E N D
Toward Mega-Scale Computing with pMatlab Chansup Byun and Jeremy Kepner MIT Lincoln Laboratory Vipin Sachdeva and Kirk E. Jordan IBM T.J. Watson Research Center HPEC 2010 This work is sponsored by the Department of the Air Force under Air Force contract FA8721-05-C-0002. Opinions, interpretations, conclusions and recommendations are those of the author and are not necessarily endorsed by the United States Government.
Outline Introduction Performance Studies Optimization for Large Scale Computation Summary • What is Parallel Matlab (pMatlab) • IBM Blue Gene/P System • BG/P Application Paths • Porting pMatlab to BG/P
Layered Architecture for parallel computing Kernel layer does single-node math & parallel messaging Library layer provides a parallel data and computation toolbox to Matlab users Parallel Matlab (pMatlab) Output Analysis Input Application Library Layer (pMatlab) Conduit Task User Interface Comp Vector/Matrix Parallel Library Kernel Layer Hardware Interface Messaging (MatlabMPI) Math (MATLAB/Octave) Parallel Hardware
IBM Blue Gene/P System LLGrid Core counts: ~1K cores Blue Gene/P Core counts: ~300K Core speed: 850 MHz
Blue Gene Application Paths Blue Gene Environment High Throughput Computing (HTC) High Performance Computing (MPI) Highly Scalable Message Passing Apps Serial and Pleasantly Parallel Apps • High Throughput Computing (HTC) • Enabling BG partition for many single-node jobs • Ideal for “pleasantly parallel” type applications
HTC Node Modes on BG/P Symmetrical Multiprocessing (SMP) mode One process per compute node Full node memory available to the process Dual mode Two processes per compute node Half of the node memory per each process Virtual Node (VN) mode Four processes per compute node (one per core) 1/4th of the node memory per each process
Porting pMatlab to BG/P System • Requesting and booting a BG partition in HTC mode • Execute “qsub” command • Define number of processes, runtime, HTC boot script (htcpartition --trace 7 --boot --mode dual \ • --partition $COBALT_PARTNAME) • Wait for the partition ready (until the boot completes) • Running jobs • Create and execute a Unix shell script to run a series of “submit” commands including • submit -mode dual -pool ANL-R00-M1-512 \ • -cwd /path/to/working/dir -exe /path/to/octave \ • -env LD_LIBRARY_PATH=/home/cbyun/lib \ • -args “--traditional MatMPI/MatMPIdefs523.m” • Combine the two steps • eval(pRUN(‘m_file’, Nprocs, ‘bluegene-smp’))
Outline Introduction Performance Studies Optimization for Large Scale Computation Summary • Single Process Performance • Point-to-Point Communication • Scalability
Performance Studies Single Processor Performance • MandelBrot • ZoomImage • Beamformer • Blurimage • Fast Fourier Transform (FFT) • High Performance LINPACK (HPL) Point-to-Point Communication • pSpeed Scalability • Parallel Stream Benchmark: pStream
Single Process Performance:Intel Xeon vs. IBM PowerPC 450 11.9 s 18.8 s 6.1 s 1.5 s 26.4 s 5.2 s MandelBrot ZoomImage* Beamformer FFT HPL Blurimage* Lower is better * conv2() performance issue in Octave has been improved in a subsequent release
Octave Performance With Optimized BLAS DGEM Performance Comparison MFLOPS Matrix size (N x N)
Single Process Performance:Stream Benchmark Triad a = b + q c Scale b = q c Add c = a + c Relative Performance to Matlab Higher is better 944 MB/s 1208 MB/s 996 MB/s
Point-to-Point Communication Pid = 0 Pid = Np-1 Pid = 1 Pid = 2 Pid = 3 • pMatlab example: pSpeed • Send/Receive messages to/from the neighbor. • Messages are files in pMatlab.
Filesystem Consideration A single NFS-shared disk (Mode S) Pid = 0 Pid = 0 Pid = Np-1 Pid = Np-1 Pid = 1 Pid = 1 Pid = 2 Pid = 2 Pid = 3 Pid = 3 • A group of cross-mounted, NFS-shared disks to distribute messages (Mode M)
pSpeed Performance on LLGrid: Mode S Higher is better
pSpeed Performance on LLGrid:Mode M Lower is better Higher is better
pSpeed Performance on BG/P BG/P Filesystem: GPFS
pStream Results with Scaled Size • SMP mode: Initial global array size of 2^25 for Np=1 • Global array size scales proportionally as number of processes increases (1024x1) 563 GB/sec 100% Efficiency at Np = 1024
pStream Results with Fixed Size • Global array size of 2^30 • The number of processes scaled up to 16384 (4096x4) DUAL: 4.333 TB/Sec 96% efficiency at Np=8192 VN: 8.832 TB/Sec 101% efficiency at Np=16384 SMP: 2.208 TB/Sec 98% efficiency at Np=4096
Outline Introduction Performance Studies Optimization for Large Scale Computation Summary • Aggregation
Current Aggregation Architecture The leader process receives all the distributed data from other processes. All other processes send their portion of the distributed data to the leader process. The process is inherently sequential. The leader receives Np-1 messages. 0 1 2 3 4 5 6 7 8 Np = 8 Np: total number of processes
Binary-Tree Based Aggregation BAGG: Distributed message collection using a binary tree The even numbered processes send a message to its odd numbered neighbor The odd numbered processes receive a message from its even numbered neighbor. 0 1 2 3 0 4 5 2 6 7 4 0 6 4 Maximum number of message a process may send/receive is N, where Np = 2^(N)
BAGG() Performance Two dimensional data and process distribution Two different file systems are used for performance comparison IBRIX: file system for users’ home directories LUSTRE: parallel file system for all computation IBRIX: 10x faster at Np=128 LUSTRE: 8x faster at Np=128
BAGG() Performance, 2 Four dimensional data and process distribution With GPFS file system on IBM Blue Gene/P System (ANL’s Surveyor) From 8 processes to 1024 processes 2.5x faster at Np=1024
Generalizing Binary-Tree Based Aggregation HAGG: Extend the binary tree to the next power of two number Suppose that Np = 6 The next power of two number: Np* = 8 Skip any messages from/to the fictitious Pid’s. 0 1 2 3 0 4 5 2 6 7 4 0 6 4
BAGG() vs. HAGG() HAGG() generalizes BAGG() Removes the restriction (Np = 2^N) in BAGG() Additional costs associated with bookkeeping Performance comparison on two dimensional data and process distribution ~3x faster at Np=128
BAGG() vs. HAGG(), 2 Performance comparison on four dimensional data and process distribution Performance difference is marginal on a dedicated environment SMP mode on IBM Blue Gene/P System
BAGG() Performance with Crossmounts Significant performance improvement by reducing resource contention on file system Performance is jittery because production cluster is used for performance test Lower is better
Summary pMatlab has been ported to IBM Blue Gene/P system Clock-normalized, single process performance of Octave on BG/P system is on-par with Matlab For pMatlab point-to-point communication (pSpeed), file system performance is important. Performance is as expected with GPFS on BG/P Parallel Stream Benchmark scaled to 16384 processes Developed a new pMatlab aggregation function using a binary tree to scale beyond 1024 processes