Download
1 / 1
30 likes | 160 Views
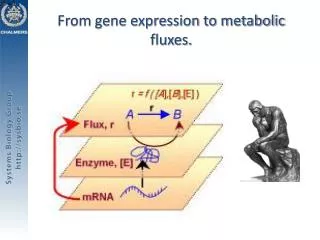
Predict Lipid Source Short chain Long chain Branched/Odd-Chain Fas Cholesterol Use in vivo TB expression to predict phagolysome environment Gary Schoolnick - RT-PCR from resected human lung samples. Effect of Drug. 3. 2. Increased. 1.

E N D
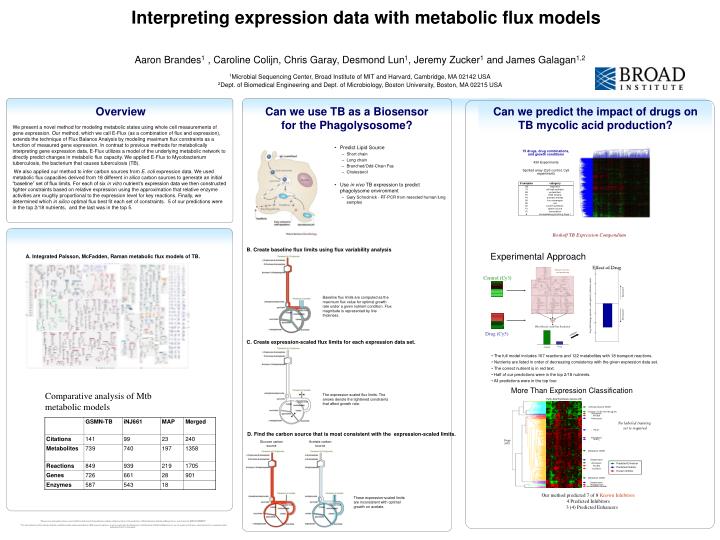
Predict Lipid Source • Short chain • Long chain • Branched/Odd-Chain Fas • Cholesterol • Use in vivo TB expression to predict phagolysome environment • Gary Schoolnick - RT-PCR from resected human lung samples Effect of Drug 3 2 Increased 1 Log fold change mycolic acid capacity (arbitrary units) -1 Decreased -2 -3 Interpreting expression data with metabolic flux models Aaron Brandes1 , Caroline Colijn, Chris Garay, Desmond Lun1, Jeremy Zucker1 and James Galagan1,2 1Microbial Sequencing Center, Broad Institute of MIT and Harvard, Cambridge, MA 02142 USA 2Dept. of Biomedical Engineering and Dept. of Microbiology, Boston University, Boston, MA 02215 USA Overview Can we use TB as a Biosensor for the Phagolysosome? Can we predict the impact of drugs on TB mycolic acid production? We present a novel method for modeling metabolic states using whole cell measurements of gene expression. Our method, which we call E-Flux (as a combination of flux and expression), extends the technique of Flux Balance Analysis by modeling maximum flux constraints as a function of measured gene expression. In contrast to previous methods for metabolically interpreting gene expression data, E-Flux utilizes a model of the underlying metabolic network to directly predict changes in metabolic flux capacity. We applied E-Flux to Mycobacterium tuberculosis, the bacterium that causes tuberculosis (TB). We also applied our method to infer carbon sources from E. coli expression data. We used metabolic flux capacities derived from 18 different in silico carbon sources to generate an initial “baseline” set of flux limits. For each of six in vitro nutrient’s expression data we then constructed tighter constraints based on relative expression using the approximation that relative enzyme activities are roughly proportional to the expression level for key reactions. Finally, we determined which in silico optimal flux best fit each set of constraints. 5 of our predictions were in the top 2/18 nutrients, and the last was in the top 5. B. Create baseline flux limits using flux variability analysis Experimental Approach A. Integrated Palsson, McFadden, Raman metabolic flux models of TB. Optimize mycolic acid production • 75 drugs, drug combinations, and growth conditions • 436 Experiments • Spotted array (Cy3 control, Cy5 experiment) Control (Cy3) Baseline flux limits are computed as the maximum flux value for optimal growth rate under a given nutrient condition. Flux magnitude is represented by line thickness. FBA Mycolic Acid Flux Prediction Drug (Cy5) compare C. Create expression-scaled flux limits for each expression data set. Drug Control • The full model includes 167 reactions and 122 metabolites with 18 transport reactions. • Nutrients are listed in order of decreasing consistency with the given expression data set. • The correct nutrient is in red text. • Half of our predictions were in the top 2/18 nutrients. • All predictions were in the top four. Boshoff TB Expression Compendium More Than Expression Classification Comparative analysis of Mtb metabolic models The expression-scaled flux limits. The arrows denote the tightened constraints that affect growth rate. Fatty Acid Synthesis Genes (29) Chloropromazine-GSNO Triclosan (10,50,100,150 µg/ml) Rifampicin PA-824 Valinomycin No labeled training set is required PA-21 D. Find the carbon source that is most consistent with the expression-scaled limits. Ethambutol ZnSO4 Drugs (437) Glucose carbon source Acetate carbon source Menadione-GSNO Streptomycin Predicted Enhancer Rifampicin PA-824 Predicted Inhibitor Cerulenin Known Inhibitor Menadione-GSNO Streptomycin Thiolactomycin Isoniazid/Ethionamide Our method predicted 7 of 8 Known Inhibitors 4 Predicted Inhibitors 3 (4) Predicted Enhancers These expression-scaled limits are inconsistent with optimal growth on acetate. "This project has been funded in whole or in part with Federal funds from the National Institute of Allergy and Infectious Diseases National Institutes of Health, Department of Health and Human Services, under Contract No. HHSN272200800059C" ‘‘The views expressed in written conference materials or publications and by speakers and moderators at HHS-sponsored conferences, do not necessarily reflect the official policies of the Department of Health and Human Services; nor does mention of trade names, commercial practices, or organizations imply endorsement by the U.S. Government.’’