Download
1 / 28
290 likes | 501 Views
Political, Economic & Demographic Challenges and Drivers of PSD in East Africa Dar es Salaam, 10 April 2013. South Sudan. 3 key issues from a development perspective : E – E conomic geography A – A symmetry of costs/benefits C – C apacity/coordination, C orruption & C ommitment.

E N D
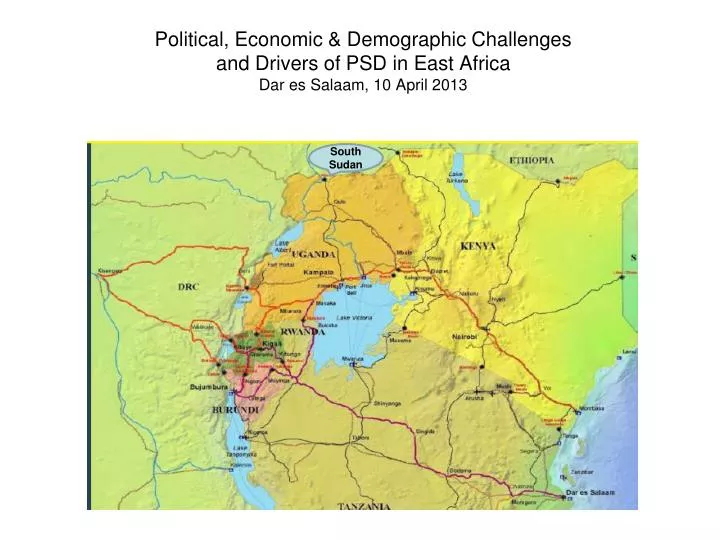
Political, Economic & Demographic Challengesand Drivers of PSD in East AfricaDar es Salaam, 10 April 2013 South Sudan
3 key issues from a development perspective: E – Economic geography A – Asymmetry of costs/benefits C – Capacity/coordination, Corruption & Commitment
Economic geographyPopulation (2005-2030); Real GDP (2000-2010)
Economic geographyReal GDP in East Africa (2000-2010) • But, need to keep in perspective… combined GDP size of Croatia…
Economic geographyTrade Performance (2000-2010) • Fourfold increase in trade 2000-2010 • Trade in 2010 worth 47% of East Africa GDP cf 28% in 2000
Economic geographyTop Three Exports (2010) • 47% of East African exports from Kenya; 36% Tanzania
Economic geographyTop Three Imports (2010) • 44% of East African imports to Kenya; 29% Tanzania
Economic geographyExport composition (2010) • Relatively diverse export base in Tanzania, Uganda, Kenya
Economic geographyIntra Regional trade as % of Total Trade (1990-2010) • Value ($4.1bn) doubled 2005-2010, but share fell from 13% to 11% • NB. only 5% African trade is internal cf 40-60% in EU, NAFTA, Asia.. • Discrepancies in published data may indicate increasing informal cross border trade
Economic geographyForeign Direct Investment (2000-2010) • 152% increase in FDI over 2000-2010 • Uganda largest since 2007 ($25 per capita cf $16 in Tanzania; $2-$4 for rest)
Economic GeographyEconomic density map • Rapid urbanisation • Kampala, Dar, Mombasa, Kigali, Nairobi in top 20 fastest growing cities in world
Economic geographyPopulation density in EAC & selected comparators
Economic GeographyShare of population living below the (national) poverty line • Mixed performance • Falling number/share in Uganda, Rwanda; Burundi very high…
Asymmetry of costs/benefits • 40% of E. Africans live in landlocked countries (vs. world average of 1%) • Av. transport costs 60-70% higher per km in EAvs USA/EU
Asymmetry of costs/benefitsNorthern Corridor traffic projection • Four fold volume increase on Northern Corridor (doubling by 2015) • RVR derailments “only” 20 per month….
Asymmetry of costs/benefitsCentral Corridor traffic projection • Seven fold volume increase on Central Corridor • CDS cost estimate $4.2bn for both corridors ($1.7bn committed)
Asymmetry of costs/benefits Asymmetric impact of integration policies: • Regional public goods do not necessarily benefit all members equally Coupled with….. • lack of clarity on investment priorities; • complex co-financing arrangements across borders; • lack of risk capital for project preparation; • weak capacity to undertake early stage project preparation; • lack of alignment of national policies (eg. harmonising legal/regulatory frameworks, including PPPs); • weak links between required provision of “hard” and “soft” infrastructure (eg. border post infra and integrated border management); • poor coordination between development partners.
The four Cs – Corruption, Capacity/Coordination, & Commitment
The four Cs…Perceptions of Corruption (2005-2010) • Index ranges from 1 (corrupt) to 10 (clean) • Significant improvement in Rwanda; Burundi now worst… • Importance of continuous political economy analysis
The four CsCapacity/coordination • Weaknesses of EAC structure: (Summit: Council of Ministers; Coordination Committee (Permanent Secretaries); Sectoral Committees; The Secretariat; East African Legislative Assembly; East African Court of Justice; Institutions (egEADB, LVBC, CASSOA….) • Weak power of Secretariat and EACJ in particular • National vs regional tension • Weaknesses of donor coordination: • Similar issues !
The four CsCommitment (to regional integration) • EAC “Gentleman’s club” both a strength and weakness…. • Uncertain impact of (possible) new leadership? • 2013: Kibaki (Kenya) • 2015: Nkurunziza (Burundi) and Kikwete (Tanzania) • 2016: Museveni (Uganda) • 2017: Kagame (Rwanda)
Ideas for discussion Do we need to encourage more regional initiatives? “Go coastal, think global ?” “EIZ - Economic integration zone(s)” ? (cf. coastal SEZs in China, India) “Education policy – focus on labour mobility” ? Development fund?