Download
1 / 38
380 likes | 387 Views
STEM workforce needs of the U.S. Department of Defense: Background data. Rolf Lehming NAE/NRC August 1, 2011 National Science Foundation National Center for Science and Engineering Statistics www.nsf.gov/statistics/.

E N D
STEM workforce needs of the U.S. Department of Defense: Background data Rolf Lehming NAE/NRC August 1, 2011 National Science Foundation National Center for Science and Engineering Statistics www.nsf.gov/statistics/
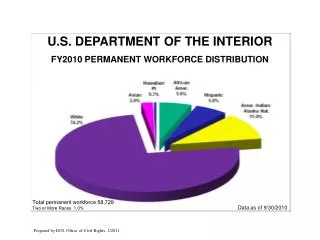
NS&E = natural sciences and engineering; underrepresented minorities = Black, Hispanic, American Indian/Alaska native SOURCE: NSF?NCSES, WebCaspar data system.
DOD STEM employment • DOD: major employer of STEM workers, especially IT both hard- and software • DOD civilian workforce is getting more NS&E intensive • Between 15% and 30% of physical scientists and IT specialists are retirement eligible
NS&E bachelor’s degrees • Modest increases in engineering and physical sciences degrees over 15 years, big increases in life sciences, computer science degrees slipping broadly after “Y2K” peak • Physical sciences and engineering bachelor’s degrees closely mirror college-age cohort size • Blacks and Hispanics earn NS&E bachelor’s degree percentages well below their population share. Asians exceed it, as do Whites to a lesser extent
NS&E master’s degrees • A quarter of U.S. NS&E master’s degrees are earned by temporary visa holders • Nearly half in engineering, half in math/computer science, 60% in electrical/electronic engineering • U.S. majority whites earn sharply lower shares of NS&E master’s degrees, 10 percentage points or more below 1995 levels • Exception is physical sciences—stable share
NS&E doctorates • More than one-third of U.S. NS&E doctorates are earned by temporary visa holders • 57% of those in engineering and well above half in electrical engineering and computer science • Recently the percentage of NS&E doctorates earned by temporary visa holders has declined • More than half of temporary visa holders earning a U.S. doctorate choose to stay in the U.S., and many of them eventually remain here
Questions? Rolf Lehming rlehming@nsf.gov 703-292-7810 Nirmala Kannankutty nkannank@naf.gov 703-292-7797 Jaquelina Falkenheim jfalkenh@nsf.gov 703-292-7798 We are now the National Center for Science and Engineering Statistics A new name. A broader mission. www.nsf.gov/statistics