Download
1 / 19
190 likes | 213 Views
Data Analysis in Particle Physics. December 1, 2010 Timothy Harrington-Taber. Data Analysis in Particle Physics. Historical Review What we get from the detector Pre-processing of data Cutting and fitting Monte Carlo simulations. History of Particle Data Analysis.

E N D
Data Analysis in Particle Physics December 1, 2010 Timothy Harrington-Taber
Data Analysis in Particle Physics • Historical Review • What we get from the detector • Pre-processing of data • Cutting and fitting • Monte Carlo simulations
History of Particle Data Analysis • Essentially limited by detectors • Manual count of scintillator hits (early 1900’s) • Cloud chamber (1930’s) • Bubble chamber (1950’s)
Particle Track Tracing • Bubble and cloud chambers provided excellent information about the path of the particle, but the photographs typically had to be manually examined to obtain physical information about ionizing particles. • Time-consuming to analyze and produce
Directly Available Information • At the fundamental level, detectors provide information about where particles were found when. • Momentum, energy, charge, etc. are usually derived based on “reading” these measurements based on our knowledge of the detector
Event Reconstruction • Detector hits are reconstructed into tracks that best explain the pattern observed • Sometimes, one particle is reconstructed as two separate tracks… or two particles are reconstructed as only one track • Energy, momentum, and charge associated with the track is recorded, along with track length and position of origin
Data Profile • With the charge, momentum, energy and decay length of the track, the reconstruction software can determine the likelihood of the track being caused by a specific particle • Other information available includes the number of hits assigned to the track in a given detector, its isolation from other tracks, and missing energy/momentum in the collision
Analyzing Data • No longer done by hand • Specialized computer software filters and analyzes events for patterns of interest • ROOT Data Analysis Framework is described as a set of object-oriented frameworks, usable within C++, optimized for particle physics work
Example of using ROOT • Declare the process of interest (decay of B-meson to J/ψππK with J/ψ decaying to two muons) • Run script to filter those reconstructed particles matching this pattern to make available a smaller file containing only events roughly matching criteria
Cutting and Fitting • Not all events that pass a filter will be the process or particle intended • Leaving out certain events based on values of particular parameters (cutting) allows for better identification of the particle/decay in question • Typically, the cut data can be fit to a “signal” distribution and a “background” distribution
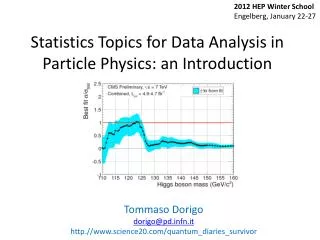
Fitting Procedure • Most often, data is plotted as a histogram with the number of counts per bin on the vertical axis and the relevant variable on the horizontal (e.g. Energy or Momentum) • ROOT can be used to determine background and signal fits, giving numbers of events to each distribution included in the fit • 3σ signifies “evidence”, 5σ is a “discovery”
Significance • Another measure of the strength of the signal is known as the significance • This measures the amount of signal S to the amount of background B • Significance • Integrated over the region near the peak of the signal
Example (continued) • This file will still probably be too large to use reasonably • Apply preliminary cuts, and filter data to only include parameters that might be used in the optimization process • Note: leaving out a parameter will require repeating this step if later optimization requires its use
Optimization of Fit Parameters • Set up a script that will step through several values of a particular cut (leaving others fixed) and return the significance for each value • Repeat for other optimization parameters • Adjust fixed values of optimization parameters based on previous round of analysis (plotting data now is a good idea as a check) • Repeat until no longer able to improve significance
Understanding the data • Certain processes other than those directly studied may pass the cuts used • Measured values from previous experiment may be used to predict parameters that we expect to observe, or to provide expected cross-sections based on particular unknowns present in the data
Monte Carlo Analysis • One of the strongest tools in determining likely detector response to physical processes is to perform a Monte Carlo simulation • A Monte Carlo simulation randomly and repeatedly selects parameters from a specified domain and uses them to create its results
Monte Carlo in Particle Physics • In particle physics, a decay particle and decay mode are specified • Angular distribution and subsequent decays are determined randomly within specified boundaries • Interaction with the detector is also treated randomly (where the process is random), and the reconstruction algorithm is applied
Monte Carlo Usage • The Monte Carlo model of the process can be compared to the data obtained • Most detectors have existing Monte Carlo simulations of “background” events of various kinds to assist in the measurement of cross-section of a particular process
Data Analysis • History • Types of Data Obtainable • Event Reconstruction • Cutting and Fitting • Brief Overview of Monte Carlo methods