Download
1 / 4
40 likes | 57 Views
Learn about the differences between data visualization and data transformation in this comprehensive guide. Discover the purposes, techniques, benefits, and limitations of each method, as well as best practices for using them effectively. Whether you're a business user or a data analyst, understanding the difference between dashboard visualization and data transformation can help you make better decisions based on accurate data. For more information, Grow.com<br>

E N D
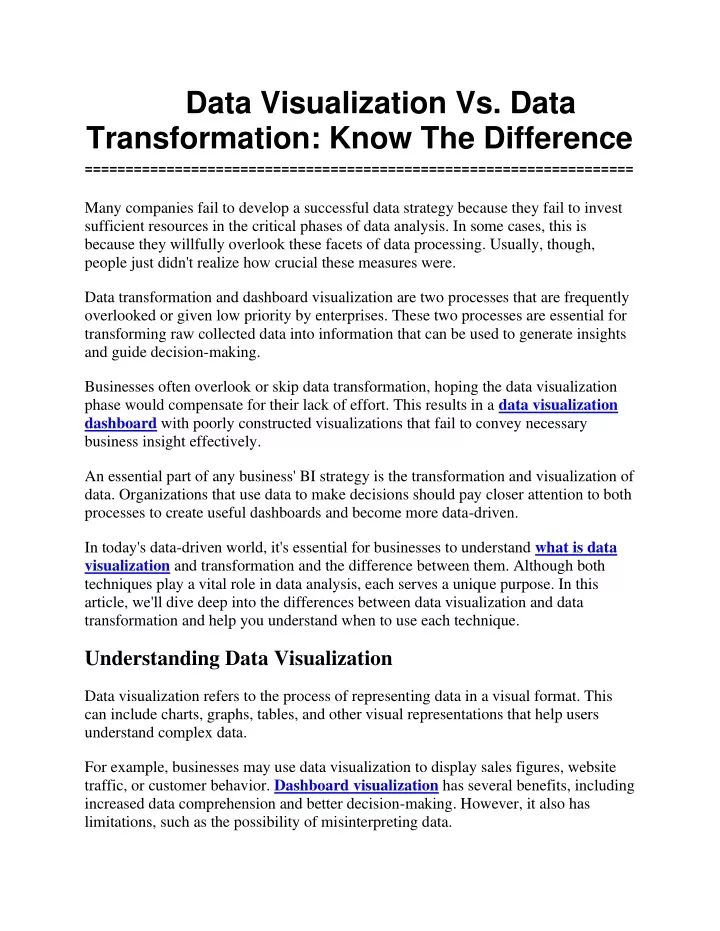
Data Visualization Vs. Data Transformation: Know The Difference =================================================================== Many companies fail to develop a successful data strategy because they fail to invest sufficient resources in the critical phases of data analysis. In some cases, this is because they willfully overlook these facets of data processing. Usually, though, people just didn't realize how crucial these measures were. Data transformation and dashboard visualization are two processes that are frequently overlooked or given low priority by enterprises. These two processes are essential for transforming raw collected data into information that can be used to generate insights and guide decision-making. Businesses often overlook or skip data transformation, hoping the data visualization phase would compensate for their lack of effort. This results in a data visualization dashboard with poorly constructed visualizations that fail to convey necessary business insight effectively. An essential part of any business' BI strategy is the transformation and visualization of data. Organizations that use data to make decisions should pay closer attention to both processes to create useful dashboards and become more data-driven. In today's data-driven world, it's essential for businesses to understand what is data visualization and transformation and the difference between them. Although both techniques play a vital role in data analysis, each serves a unique purpose. In this article, we'll dive deep into the differences between data visualization and data transformation and help you understand when to use each technique. Understanding Data Visualization Data visualization refers to the process of representing data in a visual format. This can include charts, graphs, tables, and other visual representations that help users understand complex data. For example, businesses may use data visualization to display sales figures, website traffic, or customer behavior. Dashboard visualization has several benefits, including increased data comprehension and better decision-making. However, it also has limitations, such as the possibility of misinterpreting data.
Understanding Data Transformation To transform data is to change its form from one format to another. This can include cleaning and organizing data, converting data from one system to another, or aggregating data from multiple sources. Data transformation is crucial for data analysis, as it helps ensure data accuracy and consistency. However, it may require a lot of effort and resources at your end. Differences between Data Visualization and Data Transformation The fundamental difference between data visualization and data transformation is their purpose. Data visualization helps users understand data by presenting it in a visual format, while data transformation ensures data accuracy and consistency. Data visualization is useful when businesses need to quickly understand data trends, whereas data transformation is useful when businesses need to ensure data accuracy before analysis. When to Use Data Visualization Data visualization is more effective when businesses need to quickly understand data trends. For example, if a business wants to understand the impact of a marketing campaign, they may use data visualization to display the campaign's results. Data visualization is also useful when businesses need to communicate data trends to non- technical stakeholders. When to Use Data Transformation Data transformation is more effective when businesses need to ensure data accuracy before analysis. For example, if a business is merging data from multiple sources, they may use data transformation to ensure the data is consistent across all sources. Data transformation is also useful when businesses need to automate data processing.
Combining Data Visualization and Data Transformation Data visualization and data transformation complement each other and can be used together to improve data analysis. For example, businesses may use data transformation to clean and organize data before visualizing it. They may also use data visualization to identify data patterns that need further transformation. Conclusion Data visualization and data transformation are both critical components of data analysis. By understanding the differences between the two techniques and when to use each, businesses can make better-informed decisions. Whether it's using dashboard visualization to quickly identify data trends or data transformation to ensure data accuracy, businesses can leverage these techniques to improve their data analysis capabilities. Grow is a no-code data visualization tool that allows users to connect, transform, and visualize their data without coding or technical expertise. With Grow, businesses can quickly and easily create custom dashboards, charts, and reports that provide
insights into their data. Our data visualization dashboard supports many data sources, including spreadsheets, databases, and cloud services. With Grow's intuitive drag-and-drop interface, users can create powerful data visualizations that can be easily shared. Additionally, the data visualization dashboard provides real-time data insights and analytics, enabling businesses to make informed decisions based on up-to-date information. Using Grow's no-code data visualization tool is a powerful solution for businesses looking to unlock the insights hidden in their data. Looking to improve your business performance? Check out Grow.com Reviews & Ratings on TrustRadius for 2022 and discover why so many users are raving about this powerful business intelligence tool. Take your business to the heights it deserves.