Download
1 / 12
120 likes | 121 Views
This project aims to apply Topological Data Analysis (TDA) to construct a multiresolution image of a given dataset, analyze the images generated using TDA mapper, and compare the results with other techniques such as hierarchical clustering. The project also discusses the benefits and limitations of TDA and provides a background understanding of the dataset. The results and discussions section includes the analysis of the images and concludes with insights and areas of interest identified. Funding and conflicts are acknowledged, and the project includes commented R code and relevant references.

E N D
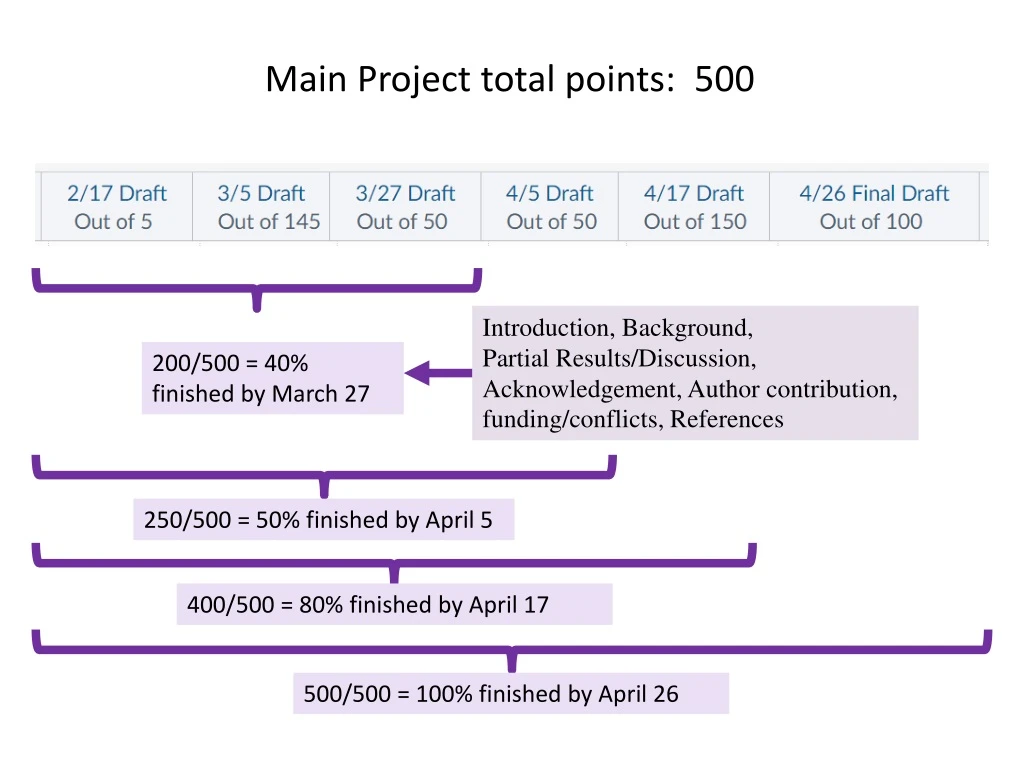
Main Project total points: 500 Introduction, Background, Partial Results/Discussion, Acknowledgement, Author contribution, funding/conflicts, References 400/500 = 80% finished by April 17 500/500 = 100% finished by April 26 250/500 = 50% finished by April 5 200/500 = 40% finished by March 27
For 400 point draft due Monday April 17th, I recommend • Introduction (25 points) • Include description of your data set. • How many points and in what dimension? • Describe each coordinate of a point in your dataset (what do the variables mean). • How will you compute distances between data points (or put in later section). • What is your goal and how do you plan to achieve it? • Background • Describe the TDA algorithm including benefits and limitations. Consider using example(s) to illustrate your points. (100 points) • Describe background needed to understand your data set (100 points). • Partial Results/Discussion (100 points) • Include many images from python TDA mapper and analyze these images. • Can put some images in appendix if you don’t have time to analyze all images. • Consider comparing to other techniques (e.g. hierarchical clustering). • Conclusion (20 points) • Acknowledgement, • Author contribution, Please also include your commented R code. • Funding/conflicts, (25 points) • References (20 pts) Include all parameters in figure caption. (30 points)
For 500 point project due Wednesday April 26th, I recommend • Introduction (50 points) • Include description of your data set. • How many points and in what dimension? • Describe each coordinate of a point in your dataset (what do the variables mean). • How will you compute distances between data points (or put in later section). • What is your goal and how do you plan to achieve it? • Background • Describe the TDA algorithm including benefits and limitations. Consider using example(s) to illustrate your points. (100 points) • Describe background needed to understand your data set (100 points). • Partial Results/Discussion (150 points) • Include many images from python TDA mapper and analyze these images. • Can put some images in appendix if you don’t have time to analyze all images. • Consider comparing to other techniques (e.g. hierarchical clustering). • Conclusion (50 points) • Acknowledgement, Please also include your commented R code. • Author contribution, (50 points) • Funding/conflicts, • References (20 pts) Yes, this adds up to more than 500 points. Include all parameters in figure caption. (30 points)
This construction produces a “multiresolution" or “multiscale“ image of the data set. One can actually construct a family of simplicial complexes (graphs in the case of a one-dimensional parameter space), which are viewed as images at varying levels of coarseness, and maps between them moving from a complex at one resolution to one of coarser resolution.
knn distance with k = 5, 50% overlap 3 intervals 5intervals 10 intervals 100 intervals
knn distance with k = 50, 50% overlap 3 intervals 5intervals 100 intervals 10 intervals
This fact allows one to assess the extent to which features are “real" as opposed to “artifacts", since features which persist over a range of values of the coarseness would be viewed as being less likely to be artifacts.
Note: Many, many choices were made “It is useful to think of it as a camera, with lens adjustments and other settings. A different filter function may generate a network with a different shape, thus allowing one to explore the data from a different mathematical perspective.” False positives vs. robustness http://www.nature.com/srep/2013/130207/srep01236/full/srep01236.html
False Positives will occur https://xkcd.com/882/
We do not attempt to obtain a fully accurate representation of a data set, but rather a low dimensional image which is easy to understand, and which can point to areas of interest. Note that it is implicit in the method that one fixes a parameter space, and its dimension will be an upper bound on the dimension of the simplicial complex one studies. As such, it is in a certain way analogous to the idea of a Postnikovtower or the coskeletal filtration in algebraic topology [Hat02].
We do not attempt to obtain a fully accurate representation of a data set, but rather a low dimensional image which is easy to understand, and which can point to areas of interest. Note that it is implicit in the method that one fixes a parameter space, and its dimension will be an upper bound on the dimension of the simplicial complex one studies. Depends on cover As such, it is in a certain way analogous to the idea of a Postnikovtower or the coskeletal filtration in algebraic topology [Hat02].