Download
1 / 30
300 likes | 304 Views
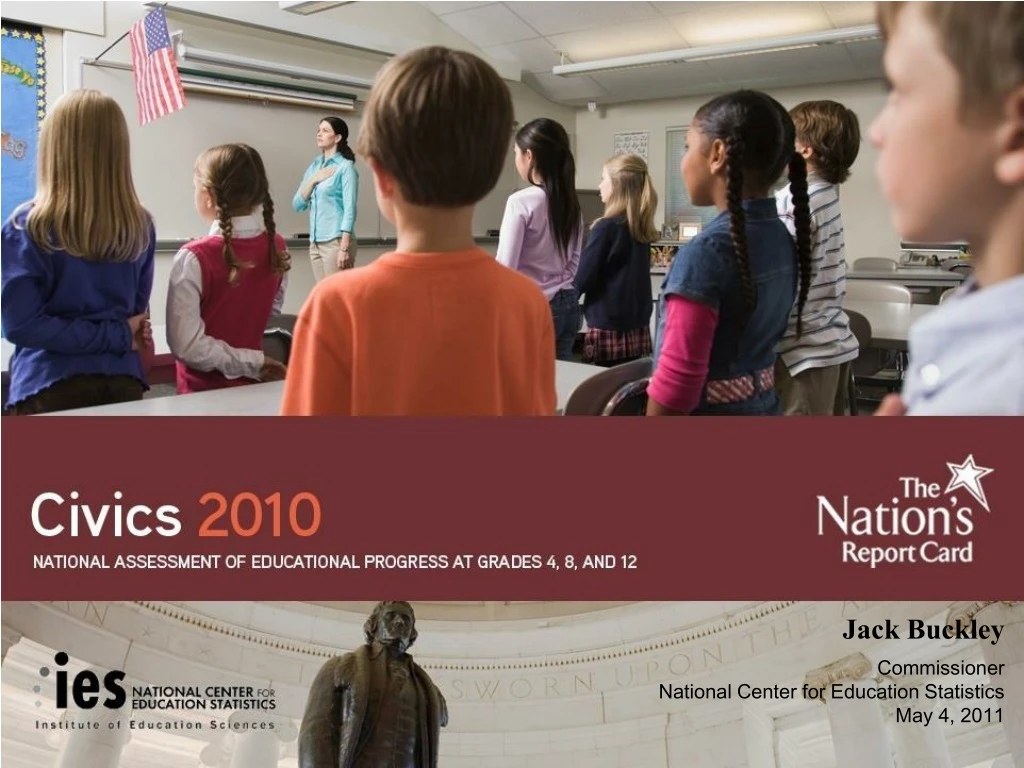
This report presents the results of the 2010 National Assessment of Civic Knowledge, measuring the performance of fourth-graders, eighth-graders, and twelfth-graders in their understanding of constitutional democracy and civic life in the United States. The report examines the average scale scores, achievement levels, and intellectual skills of students, as well as gender and racial/ethnic disparities. It also provides comparisons to previous assessments in 1998 and 2006.

E N D
Jack Buckley Commissioner National Center for Education Statistics May 4, 2011
Administered January – March 2010 National samples • 7,100 fourth-graders • 9,600 eighth-graders • 9,900 twelfth-graders Performance reported as • Average scale scores (0 – 300 scale) • Achievement levels (Basic, Proficient, Advanced) Comparisons to 1998 and 2006
Assessment questions measure knowledge of basic concepts about constitutional democracy in the United States Proportion of assessment Civic Knowledge Grade 4 Grade 8 Grade 12 Civic life 25% 15% 10% American political system 20% 25% 20% Principles of democracy 15% 25% 25% World affairs 10% 15% 20% Roles of citizens 30% 20% 25%
Each question assesses an intellectual skill students use in comprehending and interpreting civic life Proportion of assessment Intellectual Skill Grade 4 Grade 8 Grade 12 Identifying and describing 40% 35% 25% Explaining and analyzing 30% 35% 40% Evaluating, taking, and 30% 30% 35% defending a position
Some questions also measure students participatory skills and/or civic dispositions Participatory skills include: • Interacting with others • Monitoring politics and government • Influencing the processes of politics and governance Civic dispositions include: • Becoming an independent member of society • Assuming personal, political, and economic responsibilities • Respecting individual worth • Participating in civic affairs • Promoting the functioning of democracy
Fourth-graders post highest score to date Percentile scores from 1998 increase • 13 points at the 10th • 10 points at the 25th • 6 points at the 50th • 4 points at the 75th Percentile scores from 2006 increase • 4 points at the 25th
Percentages at Basic and Proficient higher in 2010 than in 1998
# Rounds to zero. * Significantly different (p < .05) from 2010. NOTE: Sample size insufficient to permit reliable estimates for American Indian/Alaska Native students in 1998.
Racial/ethnic gaps narrow from 1998 * Significantly different (p < .05) from 2010. NOTE: Black includes African American, and Hispanic includes Latino. Race categories exclude Hispanic origin. Score gaps are calculated based on differences between unrounded average scores.
Recent gains for female students create gender gap in 2010 * Significantly different (p < .05) from 2010. NOTE: Score gaps are calculated based on differences between unrounded average scores. The score differences between male and female students were not found to be statistically significant in 1998 and 2006.
Teachers report on the extent they cover civics topics * Significantly different (p < .05) from the score for “not at all.”
52% of fourth-graders identified an idea from the Declaration of Independence
Percentage of eighth-graders at Basic increases from 1998 to 2010
White – Hispanic gap narrows * Significantly different (p < .05) from 2010. NOTE: Black includes African American, and Hispanic includes Latino. Race categories exclude Hispanic origin. Score gaps are calculated based on differences between unrounded average scores.
Students from all family income levels make gains * Significantly different (p < .05) from 2010.
One-third or more of students study civics topics Percentage of students * Significantly different (p < .05) from 2010.
52% of eighth-graders were able to interpret the message in a political cartoon
Decline in twelfth-grade score since 2006 Score for students at the 75th percentile decreases
Percentage of twelfth-graders at Proficient decreases since 2006
White – Hispanic gap narrowing * Significantly different (p < .05) from 2010. NOTE: Black includes African American, and Hispanic includes Latino. Race categories exclude Hispanic origin. Score gaps are calculated based on differences between unrounded average scores.
Average score for female students declines # Rounds to zero. * Significantly different (p < .05) from 2010. NOTE: Score gaps are calculated based on differences between unrounded average scores. The score differences between male and female students were not found to be statistically significant in 2006 and 2010.
Less than one-half of twelfth-graders report studying international topics Percentage of students * Significantly different (p < .05) from 2010. * Significantly different (p < .05) from 2010.
35% of twelfth-graders demonstrated a “Complete" understanding of terms related to immigration and assimilation
Decline atgrade 12 No significant change at grade 8 Improvement at grade 4 * Significantly different (p < .05) from 2010.
Hispanic students make gains from 1998 to 2010 at all three grades
For more information http://nationsreportcard.gov