Download
1 / 43
430 likes | 655 Views
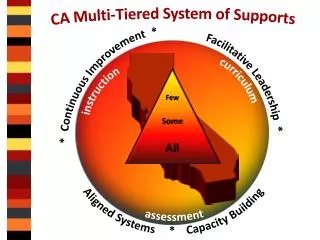
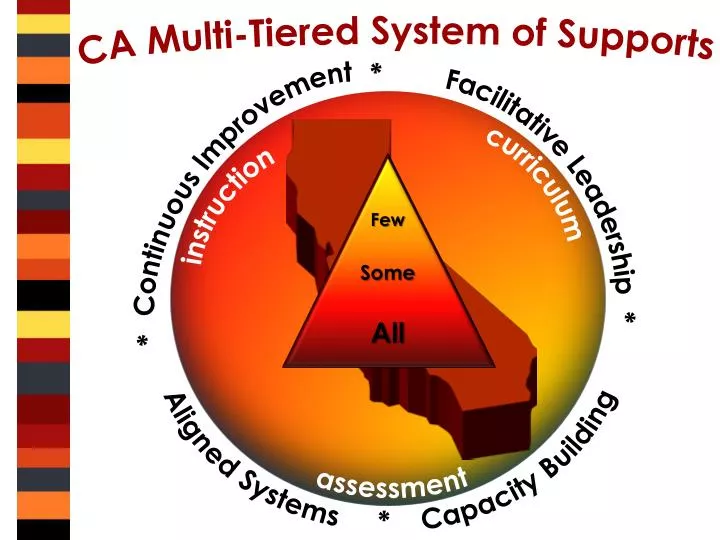
CA Multi-Tiered System of Supports. Facilitative Leadership *. * Continuous Improvement *. Aligned Systems * Capacity Building . curriculum. instruction. Few Some All. assessment. Multi-Tiered System of Supports. Professional Learning Module Series d

E N D
CA Multi-Tiered System of Supports Facilitative Leadership * * Continuous Improvement * Aligned Systems * Capacity Building curriculum instruction Few Some All assessment
Multi-Tiered System of Supports • Professional Learning Module Series • d • Unit 1: What is a Multi-Tiered System of Supports? • Unit 2: Data-based Decision Making • Unit 3: Instructional Planning and Supports • Unit 4: Leadership for Implementation of MTSS A Comprehensive Framework for Implementing the California Common Core State Standards
Learning Objectives By the end of this unit, you will be able to: • State the rationale for data-based decision making in MTSS • Define and describe the importance of universal screening and progress monitoring • Identify resources for screening and progress monitoring • Describe strategies for analyzing data to guide intervention
Unit 1Take Away Activity Multi-Tier System of Support (MTSS) By: Orla Higgins Averill, Claudia Rinaldi, Urban Special Education Leadership Collaborative Using the graphic organizer in your Unit 2 Participant Packet, note: • Features of RtI • Features of PBIS • Features of MTSS • Steps necessary to bring MTSS to scale
Time to Reflect Reflecting on your district or school • What data for academics and behavior is being consistently collected? • How is that data currently being used to guide services and supports? • What additional data would be helpful to you as you plan to deliver instruction?
Essential RtI Components (NCRTI)
Essential Concepts CA MTSS • RtI2 • Addresses the needs of ALL Students • Universal screening • Multiple tiers of intervention • Data-driven decision making • Problem solving teams • Focus on CCSS • Aligns the entire system of • initiatives, supports, and resources • Implements continuous improvement processes at all levels of the system
Data-Based Decision Making:It’s Not Just For Individual Students District Level • Objective data on student progress is used to • Guide curriculum improvement • Help educators recommend innovations and make decisions on how to sustain practices • Support targeting services and supports across schools • Guide the allocation of resources for professional development
District LevelBox and Whisker Graph 90th %ile 200 75th %ile 50th %ile 175 25th %ile 150 10th %ile 100 Target School A 75 School B 50 School C School D 25 School E Composite Grade 1 Grade 2 Grade 3
Data-Based Decision Making:It’s Not Just For Individual Students School Site Level • Objective data on student progress is used to • Examine school and grade level trends • Help determine the effectiveness of the curriculum and the fidelity of the instructional delivery
School LevelAnalyzing Growth by Ethnic Groups 140 Caucasian 120 Unidentified 100 Target Scores Words Read Correctly 80 Hispanic/Latino 60 African American 40 Asian 20 Fall Winter Spring
Data-Based Decision Making:It’s Not Just For Individual Students Grade/Course Level • Identify trends in academic and social/behavioral areas in order to: • Adjust instruction • Evaluate the effectiveness of the curriculum at that grade level • Set grade level goals • Identify students who need additional assessment or instruction
Grade LevelAnalyzing Effects of Changes to Instruction Did Not Meet Criteria (Need More Intense Intervention) 100 90 80 15 70 32 Percent 60 47 Did Not Meet Criteria (Need Some Intervention) 50 40 30 53 53 80 53 20 Met Criteria for Established Benchmark 10 Fall Winter Spring
Universal Screening • Evaluates whether students are on an appropriate learning trajectory • Conducted with all students • Answers the questions • Is the core curriculum and instruction effective for all students? • What additional assessments and/or instructional supports might be needed? • Addresses bothacademic and behavioral performance
Academic Achievement Screening Purpose • Identify which students might need additional supports Focus • All students Tools • Brief, valid, reliable, and evidence-based Timeframe • Multiple times a year • Typically fall, winter, and spring
Behavior Screening • Attendance • Grades • Discipline referrals • Teacher checklists • Teacher referrals
Cut Score • A score on a screening test that divides students who are considered potentially “at risk” from those who are considered not “at risk” Cut scores used to identify students as “at risk” may not be the same Method used to identify students who need supplemental support (National Center on Response to Intervention)
Establishing Cut Scores Cut Scores http://www.youtube.com/watch?v=l0lLkDicXZA (National Center on Response to Intervention)
Establishing Cut Scores • Educationally relevant • Based on logical practices • Based on the likelihood of demonstrated mastery of core testing • Benchmark testing • Teams should ask: • Do the screening tools we are using include national norms to establish cut scores? • Do we have local norms from our own assessments that could be used as cut scores?
Benefits ofDistrict-Established Cut Scores • May lead to more effective and efficient allocation of resources • Allows district education teams to: • Target schools with the greatest need • Identify effective approaches for scaling up in other sites • Make decisions about resources that are based on data • Make decisions about resource allocation that are relevant and timely
Benefits ofDistrict-Established Cut Scores • Increased use of data by schools and teachers • Common message and focused activities • Expectations across sites are clear and consistent • Focus is on progress • Increased access to supplemental supports
Universal Screening Resources Screening Tools Chart: http://www.rti4success.org/screeningTools/ (National Center of Response to Intervention)
Progress Monitoring • Systematic method for tracking and comparing learning progression through data collection • Involves a set of assessment procedures that determine the extent to which students are benefitting from instruction • Evaluates the effectiveness of instruction • Can be implemented with individual students or an entire class
Progress Monitoring Purpose • Monitor students’ response to interventions in order to • Estimate rates of improvement • Identify students who are not making progress • Compare the success of different forms of instruction Focus • Students who have been identified as “at risk” through the screening process Tools • Brief, valid, reliable, and evidence-based Timeframe • Monthly, weekly, or biweekly
Student Progress Data Should answer the following questions: • Are students making progress at an acceptable rate that will allow them to meet the content standards? • Are students meeting both short-term and long-term performance goals? • Can the effectiveness of the intervention be supported by data and graphed? • Does the instruction or intervention need to be adapted or changed?
Types of Progress Monitoring Diagnostic • Conducted before instruction • Measure current knowledge and skills for the purpose of planning instruction Formative • Conducted during instruction • Tell how well students are responding to instruction Summative • Conducted after instruction • Tell what a student has learned
Identify Students Not Making Adequate Progress Goal line Increasing Scores: Trend line Flat Scores: X X X X X X Trend line Goal line (NCRTI “What Is Progress Monitoring?” module 2012)
Progress Monitoring Resources Progress Monitoring Tools: http://www.rti4success.org/progressMonitoringTools/ (National Center of Response to Intervention)
Types of Decisions The Site Implementation Leadership Team asks: • How effective is the instruction? • What instructional changes need to be made? • Are the supports provided in Tiers 2 and 3 successful for individual students? • When should the team recommend additional assessments for possible identification of a disability? • How does the team know the overall effectiveness of the core curriculum, instruction for all students, interventions, and the MTSS framework?
Decision Making Routines & Procedures The District Implementation Leadership Team should establish • “Non-negotiable” areas in order to establish equity and consistency across the district • Site level procedures and routines for the grade/course level teams to use when conducting data reviews • Decision making processes • Explicit decision rules for assessing student progress
Explicit Decision Rules Define what will guide the team when • Less than 80% have reached the cut score • Lack of progress is evident • Student progress varies by target group Decision rules should be established at all levels
Data Reviews • Conduct data reviews at logical, predetermined intervals • Schedule data reviews prior to the beginning of instruction • Use established meeting structures • Involve relevant team members
Problem-Solving Process “…Problem-solving is a self-correcting, decision-making model focused on academic and/or behavioral intervention development and monitoring using frequently collected, measurable data on student performance. The problem-solving process should be rich in data collected, and can be repeated as necessary.” (The New Hampshire Response to Instruction Framework, 2012)
Continuous Improvement Problem-Solving Process 5. Communicate
1. Plan • Collect and analyze data • Define the problem • Develop aplan of action • Define the evidence-based interventions that will be used • Assign responsibilities to individual team members • Identify the necessary materials and resources • Create an implementation timeline
2. Do • Implement the plan with fidelity • Collect progress monitoring data to determine academic and behavioral success • Examine the fidelity of the implementation
3. Study • Analyze the progress monitoring data collected to determine the fidelity of implementation • Determine if • The student is making sufficient progress • The instruction or intervention is effective
4. Act • Make any necessary refinements to the plan to improve the chance of success • Might involve • Increasing the intensity of intervention • Adjusting resources • Increasing expectations • Deciding that the student will benefit from less intensive intervention
5. Communicate • Routine and frequent information sharing • Communicate successes, challenges and lessons learned All teams have information that is useful in ensuring that MTSS is effective and sustainable
Take Away Activity • Reflect on the data-driven instructional planning elements in your setting: • How do universal screening and progress monitoring occur? • Are teams established to examine student data in academics and behavior? • Are team members trained in problem-solving processes to guide decisions?
Time to Reflect • What did you learn in Unit 2? • What questions do you have?
Unit 3 Preview • Instructional practice • Universal design for learning • Differentiated instruction • Accommodations • Modifications