Download
1 / 23
230 likes | 355 Views
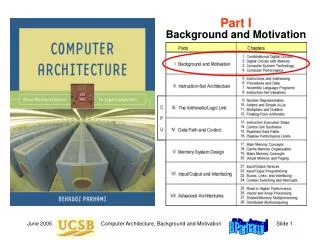
Part I Background and Motivation. I Background and Motivation. Provide motivation, paint the big picture, introduce tools: Review components used in building digital circuits Present an overview of computer technology Understand the meaning of computer performance

E N D
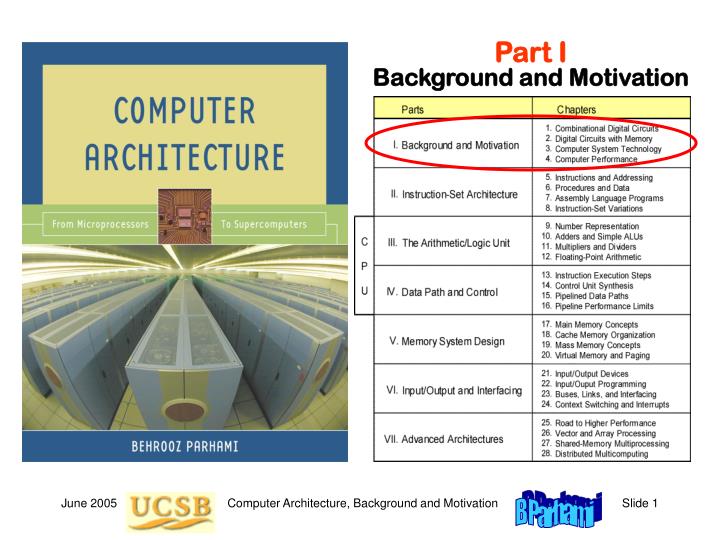
Part IBackground and Motivation Computer Architecture, Background and Motivation
I Background and Motivation • Provide motivation, paint the big picture, introduce tools: • Review components used in building digital circuits • Present an overview of computer technology • Understand the meaning of computer performance • (or why a 2 GHz processor isn’t 2 as fast as a 1 GHz model) Computer Architecture, Background and Motivation
4 Computer Performance • Performance is key in design decisions; also cost and power • It has been a driving force for innovation • Isn’t quite the same as speed (higher clock rate) Computer Architecture, Background and Motivation
4.1 Cost, Performance, and Cost/Performance Table 4.1 Key characteristics of six passenger aircraft: all figures are approximate; some relate to a specific model/configuration of the aircraft or are averages of cited range of values. Computer Architecture, Background and Motivation
Cost Effectiveness: Cost/Performance Table 4.1 Key characteristics of six passenger aircraft: all figures are approximate; some relate to a specific model/configuration of the aircraft or are averages of cited range of values. Larger values better Smaller values better Throughput (M P km/hr) 0.224 0.461 0.221 0.368 0.286 0.127 Cost /Performance 536 434 543 489 1224 630 Computer Architecture, Background and Motivation
Different Views of performance Performance from the viewpoint of a passenger: Speed Note, however, that flight time is but one part of total travel time. Also, if the travel distance exceeds the range of a faster plane, a slower plane may be better due to not needing a refueling stop Performance from the viewpoint of an airline:Throughput Measured in passenger-km per hour (relevant if ticket price were proportional to distance traveled, which in reality is not) Airbus A310 250 895 = 0.224 M passenger-km/hr Boeing 747 470 980 = 0.461 M passenger-km/hr Boeing 767 250 885 = 0.221 M passenger-km/hr Boeing 777 375 980 = 0.368 M passenger-km/hr Concorde 130 2200 = 0.286 M passenger-km/hr DC-8-50 145 875 = 0.127 M passenger-km/hr Performance from the viewpoint of FAA:Safety Computer Architecture, Background and Motivation
The Vanishing Computer Cost Computer Architecture, Background and Motivation
Cost/Performance Figure 4.1 Performance improvement as a function of cost. Computer Architecture, Background and Motivation
4.2 Defining Computer Performance Figure 4.2 Pipeline analogy shows that imbalance between processing power and I/O capabilities leads to a performance bottleneck. Computer Architecture, Background and Motivation
Concepts of Performance and Speedup Performance = 1 / Execution time is simplified to Performance = 1 / CPU execution time (Performance of M1) / (Performance of M2) = Speedup of M1 over M2 = (Execution time of M2) / (Execution time M1) Terminology: M1 is x times as fast as M2 (e.g., 1.5 times as fast) M1 is 100(x – 1)% faster than M2 (e.g., 50% faster) CPU time = Instructions (Cycles per instruction) (Secs per cycle) = Instructions CPI / (Clock rate) Instruction count, CPI, and clock rate are not completely independent, so improving one by a given factor may not lead to overall execution time improvement by the same factor. Computer Architecture, Background and Motivation
Faster Clock Shorter Running Time Figure 4.3 Faster steps do not necessarily mean shorter travel time. Computer Architecture, Background and Motivation
s = min(p, 1/f) 1 f+(1–f)/p 4.3 Performance Enhancement: Amdahl’s Law f = fraction unaffected p = speedup of the rest Figure 4.4 Amdahl’s law: speedup achieved if a fraction f of a task is unaffected and the remaining 1 – f part runs p times as fast. Computer Architecture, Background and Motivation
Amdahl’s Law Used in Design Example 4.1 • A processor spends 30% of its time on flp addition, 25% on flp mult, • and 10% on flp division. Evaluate the following enhancements, each • costing the same to implement: • Redesign of the flp adder to make it twice as fast. • Redesign of the flp multiplier to make it three times as fast. • Redesign the flp divider to make it 10 times as fast. • Solution • Adder redesign speedup = 1 / [0.7 + 0.3 / 2] = 1.18 • Multiplier redesign speedup = 1 / [0.75 + 0.25 / 3] = 1.20 • Divider redesign speedup = 1 / [0.9 + 0.1 / 10] = 1.10 • What if both the adder and the multiplier are redesigned? Computer Architecture, Background and Motivation
4.4 Performance Measurement vs. Modeling Figure 4.5 Running times of six programs on three machines. Computer Architecture, Background and Motivation
Performance Benchmarks Example 4.3 • You are an engineer at Outtel, a start-up aspiring to compete with Intel • via its new processor design that outperforms the latest Intel processor • by a factor of 2.5 on floating-point instructions. This level of performance • was achieved by design compromises that led to a 20% increase in the • execution time of all other instructions. You are in charge of choosing • benchmarks that would showcase Outtel’s performance edge. • What is the minimum required fraction f of time spent on floating-point instructions in a program on the Intel processor to show a speedup of 2 or better for Outtel? • Solution • We use a generalized form of Amdahl’s formula in which a fraction f is speeded up by a given factor (2.5) and the rest is slowed down by another factor (1.2): 1/ [1.2(1 – f) + f /2.5] 2 f 0.875 Computer Architecture, Background and Motivation
Performance Estimation Average CPI = All instruction classes (Class-i fraction) (Class-i CPI) Machine cycle time = 1 / Clock rate CPU execution time = Instructions (Average CPI) / (Clock rate) Table 4.3 Usage frequency, in percentage, for various instruction classes in four representative applications. Computer Architecture, Background and Motivation
MIPS Rating Can Be Misleading Example 4.5 • Two compilers produce machine code for a program on a machine • with two classes of instructions. Here are the number of instructions: • ClassCPICompiler 1Compiler 2 • A 1 600M 400M • B 2 400M 400M • What are run times of the two programs with a 1 GHz clock? • Which compiler produces faster code and by what factor? • Which compiler’s output runs at a higher MIPS rate? • Solution • Running time 1 (2) = (600M 1 + 400M 2) / 109 = 1.4 s (1.2 s) • b. Compiler 2’s output runs 1.4 / 1.2 = 1.17 times as fast • c. MIPS rating 1, CPI = 1.4 (2, CPI = 1.5) = 1000 / 1.4 = 714 (667) Computer Architecture, Background and Motivation
4.5 Reporting Computer Performance Table 4.4 Measured or estimated execution times for three programs. Analogy: If a car is driven to a city 100 km away at 100 km/hr and returns at 50 km/hr, the average speed is not (100 + 50) / 2 but is obtained from the fact that it travels 200 km in 3 hours. Computer Architecture, Background and Motivation
Comparing the Overall Performance Table 4.4 Measured or estimated execution times for three programs. Speedup of X over Y 10 0.1 0.1 Arithmetic mean 6.7 3.4 Geometric mean 2.15 0.46 Geometric mean does not yield a measure of overall speedup, but provides an indicator that at least moves in the right direction Computer Architecture, Background and Motivation
4.6 The Quest for Higher Performance State of available computing power ca. the early 2000s: Gigaflops on the desktop Teraflops in the supercomputer center Petaflops on the drawing board Note on terminology (see Table 3.1) Prefixes for large units: Kilo = 103, Mega = 106, Giga = 109, Tera = 1012, Peta = 1015 For memory: K = 210 = 1024, M = 220, G = 230, T = 240, P = 250 Prefixes for small units: micro = 10-6, nano = 10-9, pico = 10-12, femto = 10-15 Computer Architecture, Background and Motivation
Supercom-puters Figure 4.7 Exponential growth of supercomputer performance. Computer Architecture, Background and Motivation
The Most Powerful Computers Figure 4.8 Milestones in the DOE’s Accelerated Strategic Computing Initiative (ASCI) program with extrapolation up to the PFLOPS level. Computer Architecture, Background and Motivation
Performance is Important, But It Isn’t Everything Figure 25.1 Trend in energy consumption per MIPS of computational power in general-purpose processors and DSPs. Computer Architecture, Background and Motivation