Download
1 / 37
370 likes | 472 Views
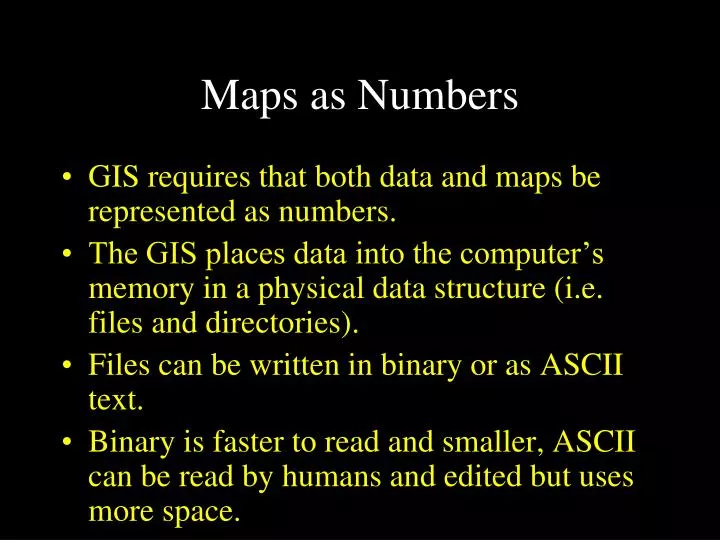
Maps as Numbers. GIS requires that both data and maps be represented as numbers. The GIS places data into the computer’s memory in a physical data structure (i.e. files and directories). Files can be written in binary or as ASCII text.

E N D
Maps as Numbers • GIS requires that both data and maps be represented as numbers. • The GIS places data into the computer’s memory in a physical data structure (i.e. files and directories). • Files can be written in binary or as ASCII text. • Binary is faster to read and smaller, ASCII can be read by humans and edited but uses more space.
Organizing Data and Information • Information can be organized as lists, numbers, tables, text, pictures, maps, or indexes. • Clusters of information called data can be stored together as a database. • A database is stored in a computer as files.
The GIS Database • In a database, we store attributes as column headers and records as rows. • The contents of an attribute for one record is a value. • A value can be numerical or text.
Record Value Value Value Record Value Value Value Record Value Value Value Flat File Database Attribute Attribute Attribute
The GIS Database (cont) • Data in a GIS must contain a geographic reference to a map, such as latitude and longitude. • The GIS cross-references the attribute data with the map data, allowing searches based on either or both. • The cross-reference is a link.
Feature Attribute Table Fields Records
Representation and Data Structures Real world - phenomena that exist Data model - an abstraction, identifying those phenomena and properties we deem relevant for our applications Data and file structures - computer representation and storage scheme of the data model, often shown as diagrams and lists
Representation and data structures Important to note the selection process as we move from real world to data model...this reflects our conceptualization, and affects much of what we can do Terms Entities - those "things" in the real world we wish to represent (Rivers, buildings, soil types, wetlands) Objects - our representation in a data model, which generally includes both geometric information (spatial data) and descriptive information (aspatial or attribute data). Entity Object
The Data Model • A logical data model is how data are organized for use by the GIS. • GISs have traditionally used either raster or vector for maps.
Data ModelsRepresentation and Data Structures Data Model – An consistent way of defining and representing spatial objects in a database, and of representing the relationships among the objects. A data model includes at least two parts – Coordinate data - pairs or triplets of numbers that define location Attribute data - text, numbers, images, or other “non- spatial” data
Discrete and Continuous Space Vector Data model – Discrete space Raster Data model – Continuous or discrete space
A raster data model uses a grid • One grid cell is one unit or holds one attribute. • Every cell has a value, even if it is “missing.” • A cell can hold a number or an index value standing for an attribute. • A cell has a resolution, given as the cell size in ground units.
Generic structure for a grid Grid extent Grid cell s w o R 23 Cell Value Resolution Columns
Raster – The Mixed Pixel Problem Landcover map – Two classes, land or water Cell A is straightforward What category to assign For B, C, or D?
Raster – The Storage Space/Resolution Tradeoff Decreasing the Cell Size by one-half causes a Four-fold increase in the storage space required
Rasters – Discrete or Continuous Features discrete continuous
RASTER • Grids are poor at representing points, lines and areas, but good at surfaces. • Grids are a natural for scanned or remotely sensed data. • Grids suffer from the mixed pixel problem.
Vectorformat Vector data are defined spatially: (x1,y1) Point- a pair of x and y coordinates vertex Line - a sequence of points Node Polygon - a closed set of lines
VECTOR • Vector data evolved the arc/node model in the 1960s. • In the arc/node model, an area consist of lines and a line consists of points. • Points, lines, and areas can each be stored in their own files, with links between them. • The topological vector model uses the line (arc) as a basic unit. Areas (polygons) are built up from arcs. • The endpoint of a line (arc) is called a node. Arc junctions are only at nodes. • Stored with the arc is the topology (i.e. the connecting arcs and left and right polygons).
n2 3 2 A 1 B n1 Topological Arcs File Arc From To PL PR n1x n1y n2x n2y 1 n1 n2 A B x y x y Basic arc topology
TOPOLOGY • Topological data structures dominate GIS software. • Topology allows automated error detection and elimination. • Rarely are maps topologically clean when digitized or imported. • A GIS has to be able to build topology from unconnected arcs. • Nodes that are close together are snapped. • Slivers due to double digitizing and overlay are eliminated.
Topology Matters • The tolerances controlling snapping, elimination, and merging must be considered carefully, because they can move features. • Complete topology makes map overlay feasible. • Topology allows many GIS operations to be done without accessing the point files.
Although Raster is FasterVector is Correcter • Vector can represent point, line, and area features very accurately. • Vectors are far more efficient than grids. • Vectors work well with pen and light-plotting devices and tablet digitizers. • Vectors are not good at continuous coverages or plotters that fill areas.
Characteristics Positional Precision Can be Precise Defined by cell size Attribute Precision Poor for continuous data Good for continuous data Analytical Capabilities Good for spatial query, adjacency, area, shape analyses. Poor for continuous data. Most analyses limited to intersections. Slower overlays. Spatial query more difficult, good for local neighborhoods, continuous variable modeling. Rapid overlays. Data Structures Often complex Often quite simple Storage Requirements Relatively small Often quite large Coordinate conversion Usually well-supported Often difficult, slow Network Analyses Easily handled Often difficult Output Quality Very good, map like Fair to poor - aliasing Comparisons, raster v.s. vector Vector Raster
Raster Vector Real World Raster-Vector Data Model