Download

1 / 38
380 likes | 387 Views
Congenital Abnormalities in Greece. Functional evaluation of statistical data. Emmanuel Brilakis, Medical Doctor Evangelos Fousteris, Medical Doctor Jannis Papadopulos, Ass. Professor Medical School of Athens University. Epidemiology. Affects 3 – 4 % of all live births

E N D
Congenital Abnormalitiesin Greece Functional evaluation of statistical data Emmanuel Brilakis, Medical Doctor Evangelos Fousteris, Medical Doctor Jannis Papadopulos, Ass. Professor Medical School of Athens University
Epidemiology • Affects 3 – 4 % of all live births • Causes many elective or spontaneous abortions • 15 – 30 % of all pediatric hospitalizations • Significant burden to families & society
Causal Factors • Genetic factors • Environmental factors • Lifestyle factors 50 – 60 % cannot be attributed in known causes Multifactorial Etiology
Objective • To record the regional distribution of mortality and hospitalization caused by congenital abnormalities in Greece • To compare the mortality and infantile mortality by congenital abnormalities between Greece and other countries • To evaluate the existence of local factors that may be involved in the generation of the problem
Material and Methods • National Statistical Service of Greece • Monthly Statistical Bulletin • Statistics of Population’s Physical Movement • Annual Statistical Yearbook of Greece • World Health Organization • Annuals
Specific infantile mortality index by congenital abnormalities per 1.000 live births
Specific infantile mortality index by congenital abnormalities per 1.000 live births
Specific infantile mortality index by congenital abnormalities per 1.000 live births
Specific infantile mortality index by congenital abnormalities per 1.000 live births GREECE GREECE BULGARIA ITALY U.S.A. FRANCE GREECE GREECE PORTUGAL SWEDEN THE NETHERLANDS JAPAN
Specific infantile mortality index by congenital abnormalities per 1.000 live births GREECE GREECE BULGARIA ITALY U.S.A. FRANCE GREECE GREECE PORTUGAL SWEDEN THE NETHERLANDS JAPAN
Specific infantile mortality index by congenital abnormalities per 1.000 live births GREECE GREECE BULGARIA ITALY U.S.A. FRANCE GREECE GREECE PORTUGAL SWEDEN THE NETHERLANDS JAPAN
Percentage of decrease of specific infantile mortality index by congenital abnormalities per 1.000 live births for each country between 1987 and 1994 Percentage of decrease * * Data not available for all this period
Percentage of decrease of specific infantile mortality index by congenital abnormalities per 1.000 live births for each country between 1987 and 1994 Percentage of decrease * * Data not available for all this period
MAP OF GREECE You are here
Specific infantile mortality index by congenital abnormalities per 1.000 live birthsin Greece &Specific mortality index by congenital abnormalities per 100.000 of population in Greece Specific infantile mortality index per 1.000 live births
Specific infantile mortality index by congenital abnormalities per 1.000 live birthsin Greece &Specific mortality index by congenital abnormalities per 100.000 of population in Greece Specific mortality index per 100.000 of population Specific infantile mortality index per 1.000 live births
1988 Percentage of deaths by congenital abnormalities in Greece from 1981 to 1995 per age of death 80% 1981–1987 & 1989-1995 10% 4% 3% 2% 1% >50 years old 5–19 years old 3–4 years old 1–2 years old till 365 days old 20–49 years old
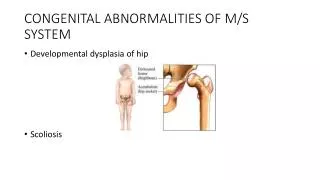
Congenital abnormalities in Greece from 1981 to 1995 per category of congenital abnormality Congenital abnormalities of heart & circulatory system 46.075 25% Undescended testicles 29.826 16% Other congenital abnormalities of musculoskeletal system 22.033 12% Other deformities of digestive system 13.747 7% Congenital dislocation of hip 9.200 5% Spina bifida & hydrocephalus 4.591 3% Cleft palate & cleft lip 4.358 2% Other deformities of C.N.S. 2.971 2% Other congenital abnormalities 50.516 28%
Specific mortality index by congenital abnormalities per 100.000 of population per geographic department of Greece from 1981 to 1995
Specific mortality index by congenital abnormalities per 100.000 of population per geographic department of Greece from 1981 to 1995
Specific mortality index by congenital abnormalities per 100.000 of population per geographic department of Greece from 1981 to 1995
Specific mortality index by congenital abnormalities per 100.000 of population per geographic department of Greece from 1981 to 1995
Discharged patients with congenital abnormalities per 100.000 of population per geographic department of Greece from 1981 to 1995
Discharged patients with congenital abnormalities per 100.000 of population per geographic department of Greece from 1981 to 1995
Discharged patients with congenital abnormalities per 100.000 of population per geographic department of Greece from 1981 to 1995
Problematic areas • Thrace • greater Athens • Crete
Deaths and discharged patients due to congenital abnormalities in ATHENS from 1981 to 1995 DEATHS 10 ATHENS GREECE 6 2 95 89 81 83 93 87 91 85 DISCHARGED PATIENTS ATHENS 140 GREECE 80 20 95 89 81 83 93 87 91 85
Deaths and discharged patients due to congenital abnormalities in CRETE from 1981 to 1995 DEATHS 10 6 CRETE GREECE 2 95 89 81 83 93 87 91 85 DISCHARGED PATIENTS 140 CRETE GREECE 80 20 95 89 81 83 93 87 91 85
Deaths and discharged patients due to congenital abnormalities in THRACE from 1981 to 1995 DEATHS THRACE 10 6 GREECE 2 95 89 81 83 93 87 91 85 DISCHARGED PATIENTS 140 GREECE GREECE THRACE 80 20 95 89 81 83 93 87 91 85
Average annual specific mortality index by congenital abnormalities per 100.000 of population in geographic regions of Greece for time period 1981 – 1995 Crete Greater Athens Thrace Ipiros Thessaly Macedonia Peloponnesus Rest of central Greece and Evia Greece’s average Aegean sea islands Ionian sea islands
Average annual specific mortality index by congenital abnormalities per 100.000 of population in geographic regions of Greece for time period 1981 – 1995 Crete Greater Athens Thrace Ipiros Thessaly Macedonia Peloponnesus Rest of central Greece and Evia Greece’s average Aegean sea islands Ionian sea islands
“Average annual specific index” of discharged patients with congenital abnormalities per 100.000 of population in geographic regions of Greece for time period 1981 – 1995 Crete Greater Athens Thrace Ipiros Thessaly Macedonia Peloponnesus Rest of central Greece and Evia Greece’s average Aegean sea islands Ionian sea islands
“Average annual specific index” of discharged patients with congenital abnormalities per 100.000 of population in geographic regions of Greece for time period 1981 – 1995 Crete Greater Athens Thrace Ipiros Thessaly Macedonia Peloponnesus Rest of central Greece and Evia Greece’s average Aegean sea islands Ionian sea islands
“Percentage of deaths/ discharged patients” with congenital abnormalities in geographic regions of Greece for time period 1981 – 1995 Greater Athens Crete Ipiros Thrace Thessaly Macedonia Rest of central Greece and Evia Peloponnesus Ionian sea islands Aegean sea islands Greece’s average
“Percentage of deaths/ discharged patients” with congenital abnormalities in geographic regions of Greece for time period 1981 – 1995 Greater Athens Crete Ipiros Thrace Thessaly Macedonia Rest of central Greece and Evia Peloponnesus Ionian sea islands Aegean sea islands Greece’s average
Conclusions More deaths by congenital abnormalities are registered in Greece than in U.S.A., France, Italy, The Netherlands, Portugal, Sweden and Japan. Greece’s infantile mortality index by congenital abnormalities presents the second lowest reduction between the selected countries in the under study period. Many fluctuations are observed in the course of indexes concerning in mortality and hospitalization in Greece during 1981 to 1995. Significant disproportions are also revealed among the geographic departments of Greece. There are lots of peaks that need further investigation.
Conclusions We tried to isolate concrete factors responsible for the problem but the data available is not sufficient. Thus, we avoided to name causal factors because we only would be hypothetical. We should mention the need of planning specific epidemiological studies (perspective and retrospective) in order to approach the possible causes. We propose the establishment of birth defects registration centres to evaluate genetic and environmental factors associated with the occurrence of congenital diseases.