Download
1 / 1
10 likes | 126 Views
Correlation Between Liposomal Contrast Agent Concentration and MRA Contrast Intensity in Rat Tumor Cells Sri Rahul Balusu, Henry Li, Julie Yeh The Wallace H. Coulter Department of Biomedical Engineering, Georgia Institute of Technology, Atlanta, GA, USA. Matlab. Data. Problem Overview.

E N D
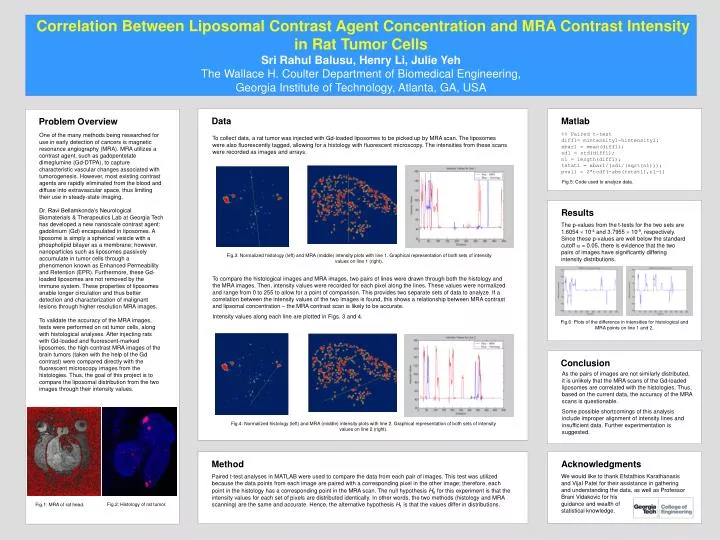
Correlation Between Liposomal Contrast Agent Concentration and MRA Contrast Intensity in Rat Tumor Cells Sri Rahul Balusu, Henry Li, Julie YehThe Wallace H. Coulter Department of Biomedical Engineering, Georgia Institute of Technology, Atlanta, GA, USA Matlab Data Problem Overview %% Paired t-test diff1= mintensity1-hintensity1; xbar1 = mean(diff1); sd1 = std(diff1); n1 = length(diff1); tstat1 = xbar1/(sd1/(sqrt(n1))); pval1 = 2*tcdf(-abs(tstat1),n1-1) One of the many methods being researched for use in early detection of cancers is magnetic resonance angiography (MRA). MRA utilizes a contrast agent, such as gadopentetate dimeglumine (Gd-DTPA), to capture characteristic vascular changes associated with tumorogenesis. However, most existing contrast agents are rapidly eliminated from the blood and diffuse into extravascular space, thus limiting their use in steady-state imaging. Dr. Ravi Bellamkonda’s Neurological Biomaterials & Therapeutics Lab at Georgia Tech has developed a new nanoscale contrast agent: gadolinium (Gd) encapsulated in liposomes. A liposome is simply a spherical vesicle with a phospholipid bilayer as a membrane; however, nanoparticles such as liposomes passively accumulate in tumor cells through a phenomenon known as Enhanced Permeability and Retention (EPR). Furthermore, these Gd-loaded liposomes are not removed by the immune system. These properties of liposomes enable longer circulation and thus better detection and characterization of malignant lesions through higher resolution MRA images. To validate the accuracy of the MRA images, tests were performed on rat tumor cells, along with histological analyses. After injecting rats with Gd-loaded and fluorescent-marked liposomes, the high-contrast MRA images of the brain tumors (taken with the help of the Gd contrast) were compared directly with the fluorescent microscopy images from the histologies. Thus, the goal of this project is to compare the liposomal distribution from the two images through their intensity values. To collect data, a rat tumor was injected with Gd-loaded liposomes to be picked up by MRA scan. The liposomes were also fluorescently tagged, allowing for a histology with fluorescent microscopy. The intensities from these scans were recorded as images and arrays. Fig.5: Code used to analyze data. Results The p-values from the t-tests for the two sets are 1.6054 10-4 and 3.7955 10-9, respectively. Since these p-values are well below the standard cutoff = 0.05, there is evidence that the two pairs of images have significantly differing intensity distributions. Fig.3: Normalized histology (left) and MRA (middle) intensity plots with line 1. Graphical representation of both sets of intensity values on line 1 (right). To compare the histological images and MRA images, two pairs of lines were drawn through both the histology and the MRA images. Then, intensity values were recorded for each pixel along the lines. These values were normalized and range from 0 to 255 to allow for a point of comparison. This provides two separate sets of data to analyze. If a correlation between the intensity values of the two images is found, this shows a relationship between MRA contrast and lipsomal concentration – the MRA contrast scan is likely to be accurate. Intensity values along each line are plotted in Figs. 3 and 4. Fig.6: Plots of the difference in intensities for histological and MRA points on line 1 and 2. Conclusion As the pairs of images are not similarly distributed, it is unlikely that the MRA scans of the Gd-loaded liposomes are correlated with the histologies. Thus, based on the current data, the accuracy of the MRA scans is questionable. Some possible shortcomings of this analysis include improper alignment of intensity lines and insufficient data. Further experimentation is suggested. Fig.4: Normalized histology (left) and MRA (middle) intensity plots with line 2. Graphical representation of both sets of intensity values on line 2 (right). Method Acknowledgments We would like to thank Efstathios Karathanasis and Vijal Patel for their assistance in gathering and understanding the data, as well as Professor Brani Vidakovic for his guidance and wealth of statistical knowledge. Paired t-test analyses in MATLAB were used to compare the data from each pair of images. This test was utilized because the data points from each image are paired with a corresponding pixel in the other image; therefore, each point in the histology has a corresponding point in the MRA scan. The null hypothesis H0for this experiment is that the intensity values for each set of pixels are distributed identically. In other words, the two methods (histology and MRA scanning) are the same and accurate. Hence, the alternative hypothesis H1 is that the values differ in distributions. Fig.2: Histology of rat tumor. Fig.1: MRA of rat head.