Download
1 / 1
10 likes | 115 Views
Interactive, Dynamic Mapping of Health and Social Justice Factors in North Carolina. Christopher J. Mansfield, PhD, MS, 1 Katherine Jones, PhD, 2 Denise Kirk, MA 3. INTRODUCTION. RESULTS. DISCUSSION.

E N D
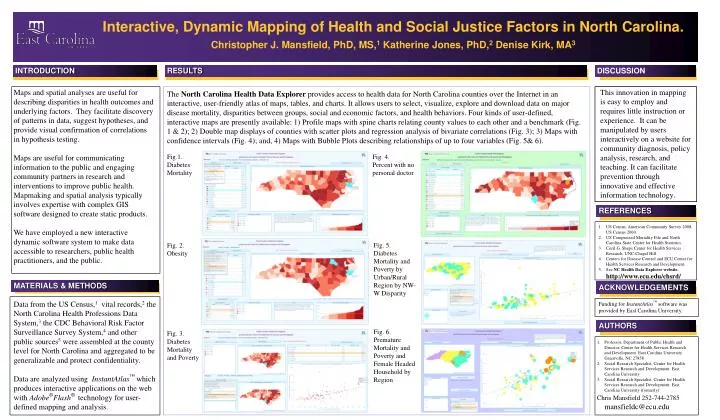
Interactive, Dynamic Mapping of Health and Social Justice Factors in North Carolina. Christopher J. Mansfield, PhD, MS,1 Katherine Jones, PhD,2 Denise Kirk, MA3 INTRODUCTION RESULTS DISCUSSION This innovation in mapping is easy to employ and requires little instruction or experience. It can be manipulated by users interactively on a website for community diagnosis, policy analysis, research, and teaching. It can facilitate prevention through innovative and effective information technology. Maps and spatial analyses are useful for describing disparities in health outcomes and underlying factors. They facilitate discovery of patterns in data, suggest hypotheses, and provide visual confirmation of correlations in hypothesis testing. Maps are useful for communicating information to the public and engaging community partners in research and interventions to improve public health. Mapmaking and spatial analysis typically involves expertise with complex GIS software designed to create static products. We have employed a new interactive dynamic software system to make data accessible to researchers, public health practitioners, and the public. The North Carolina Health Data Explorer provides access to health data for North Carolina counties over the Internet in an interactive, user-friendly atlas of maps, tables, and charts. It allows users to select, visualize, explore and download data on major disease mortality, disparities between groups, social and economic factors, and health behaviors. Four kinds of user-defined, interactive maps are presently available: 1) Profile maps with spine charts relating county values to each other and a benchmark (Fig. 1 & 2); 2) Double map displays of counties with scatter plots and regression analysis of bivariate correlations (Fig. 3); 3) Maps with confidence intervals (Fig. 4); and, 4) Maps with Bubble Plots describing relationships of up to four variables (Fig. 5& 6). Fig.1. Diabetes Mortality Fig. 4. Percent with no personal doctor REFERENCES • US Census, American Community Survey 2008, US Census 2000. • US Compressed Mortality File and North Carolina State Center for Health Statistics. • Cecil G. Sheps Center for Health Services Research. UNC-Chapel Hill. • Centers for Disease Control and ECU Center for Health Services Research and Development. • See NC Health Data Explorer website. http://www.ecu.edu/chsrd/ Fig. 5. Diabetes Mortality and Poverty by Urban/Rural Region by NW-W Disparity Fig. 2. Obesity MATERIALS & METHODS ACKNOWLEDGEMENTS Data from the US Census,1 vital records,2 the North Carolina Health Professions Data System,3 the CDC Behavioral Risk Factor Surveillance Survey System,4 and other public sources5 were assembled at the county level for North Carolina and aggregated to be generalizable and protect confidentiality. Data are analyzed using InstantAtlas™ which produces interactive applications on the web with Adobe®Flash® technology for user-defined mapping and analysis. Funding for InstantAtlas™ software was provided by East Carolina University. AUTHORS Fig. 6. Premature Mortality and Poverty and Female Headed Household by Region Fig. 3. Diabetes Mortality and Poverty • Professor, Department of Public Health and Director, Center for Health Services Research and Development. East Carolina University Greenville, NC 27858 • Social Research Specialist, Center for Health Services Research and Development. East Carolina University • Social Research Specialist, Center for Health Services Research and Development. East Carolina University (formerly) • Chris Mansfield 252-744-2785 mansfieldc@ecu.edu