Download
1 / 33
330 likes | 410 Views
WGCEP Workshop What Represents Best Available Science in terms of Time-Dependent Earthquake Probabilities? Introduction by Ned Field. Best Available Science?. Poisson Model (long-term rates) Quasi-Periodic Recurrence Models BPT Renewal Time or Slip predictable

E N D
WGCEP Workshop What Represents Best Available Science in terms of Time-Dependent Earthquake Probabilities? Introduction by Ned Field
Best Available Science? • Poisson Model (long-term rates) • Quasi-Periodic Recurrence Models • BPT Renewal • Time or Slip predictable • Static-Stress Interaction Models • Clock change • BPT-step • Rate & State • Clock change w/ Rate & State • Hardebeck (2004) approach • Empirical Rate Change Models • Clustering Models • Foreshock/Afershock statistics (e.g., STEP; ETAS)
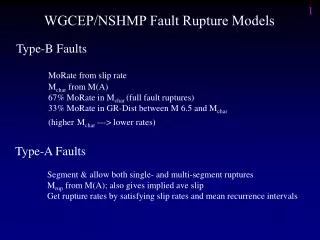
Summary (in brief) of Previous: “Working Groups on California Earthquake Probabilities” (WGCEP, 1988, 1990, 1995, 2002) They generally segmented faults and applied elastic-rebound-theory-motivated (quasi-periodic) renewal models to define time-dependent earthquake probabilities ...
Reid’s (1910) Elastic Rebound Hypothesis: Stress Loading Stress Loading Stress Loading Stress Loading EQ EQ EQ EQ Time
Reid’s (1910) Elastic Rebound Hypothesis: Perfectly Periodic more noisy system Lognormal or BPT distribution
WGCEP 1988 They divided the San Andreas, San Jacinto, Hayward, and Imperial Faults into segments and assumed each ruptures only in a single-magnitude (“characteristic”) earthquake.
WGCEP 1988 • COVI = 0.2 • Mean Recurrence Interval • from: • Ave of those observed previously. • Slip in last event divided by slip rate. • Ave slip divided by slip rate.
WGCEP 1990 Updated WGCEP (1988) for San Francisco Bay Area in light of the 1989 Loma Prieta earthquake (and some new data). e.g., applied a clock change to account for influence of Loma Prieta on Peninsula segment (seg #3).
1) Updated WGCEP (1988) segment probabilities (COVI = 0.5 +/- 0.2) WGCEP 1995 Focused on southern Cal. (SCEC’s Phase II report). Innovations: 2) Allowed neighboring segments to sometimes rupture together as “cascade” events 3) Included lesser faults and background seismicity (to account for unknown faults)
Problem results from several factors; solution exists (e.g., Stirling and Wesnousky (1997); Stein & Hanks (1998); and Field et al., (1999)) WGCEP 1995 Problem: predicted twice as many mag 6-7 events as have been observed historically, which led to a lively debate on this apparent earthquake “deficit”: Need to allow “huge” events (Mag≥8) potentially anywhere (Jackson, 1996) But such events would leave obvious scars (Schwartz, 1996; Hough, 1996)
RELM WGCEP 1995 Problem: predicted twice as many mag 6-7 events as have been observed historically, which led to a lively debate on this apparent earthquake “deficit”: Note: these two were part of the working group … implying a lack of “consensus” … Need to allow “huge” events (Mag≥8) potentially anywhere (Jackson, 1996) But such events would leave obvious scars (Schwartz, 1996; Hough, 1996) Problem results from several factors; solution exists (e.g., Stirling and Wesnousky (1997); Stein & Hanks (1998); and Field et al., (1999))
1) Updated WGCEP (1990) segment probabilities based on a more elaborate earthquake rate model; allowed cascades WGCEP 2002 Focused on Bay Area Other Innovations: 2) “Consensus process” rather than consensus model 3) Extensive treatment of epistemic uncertainties (logic-tree branches)
Current Working Group on California Earthquake Probabilities (WGCEP) Development of a Uniform California Earthquake Rupture Forecast (UCERF)
22% of our funding comes from the California Earthquake Authority (CEA)
California Earthquake Authority (CEA): Northridge caused 93% of insurers to halt or significantly reduce coverage. CEA was created (via state legislation) to resolve the crisis. CEA is a privately financed, publicly managed (and tax exempt) organization that offers basic earthquake insurance for California homeowners and renters. It’s governed by: CA Governor, Treasurer, Insurance Commissioner, Speaker of the Assembly, and Chairperson of the Senate Rules Committee. CEA policies are sold only through participating insurance companies (two-thirds of California homeowners policies). Policies carry a 15% deductible. Today the CEA has $7.2 billion to pay claims. CEA is required by law to use “best-available science”.
Best Available Science? • California Insurance Code section 10089.40 (a) • "Rates shall be based on the best available scientific information for assessing the risk of earthquake frequency, severity and loss.” • “Scientific information from geologists, seismologists, or similar experts shall not be conclusive to support the establishment of different rates … unless that information, as analyzed by experts such as the United States • Geological Survey, the California Division of Mines and Geology, and experts in the scientific or academic community, clearly shows a higher risk of earthquake frequency, severity, or loss between those most populous rating territories to support those differences.”
“Seismic Event” • “Seismic Event” means one or more earthquakes that occur within a 360-hour period. The seismic event commences upon the initial earthquake, and all earthquakes or aftershocks that occur within the 360 hours immediately following the initial earthquake are considered for purposes of this policy to be part of the same seismic event. • from page 6 of CEA’s • “Basic Earthquake Policy--Homeowners” doc
1988 1990 1995 UCERF 2002 WGCEP Goals: To provide the California Earthquake Authority (CEA) with a statewide, time-dependent ERF that uses “best available science” and is endorsed by the USGS, CGS, and SCEC, and is evaluated by a Scientific Review Panel (SRP), CEPEC, and NEPEC Coordinated with the next National Seismic Hazard Mapping Program (NSHMP) time-independent model This will be used by CEA to set earthquake insurance rates (they want 5-year forecasts, maybe 1-year in future)
SCEC will provide CEA with a single-point interface to the project. WGCEP Organization & Funding Sources CEA Geoscience organizations SCEC NSF Management oversight committee Scientific review panel USGS Menlo Park USGS MOC SRP Sources of WGCEP funding USGS Golden Bill Ellsworth (chair) Art Frankel David Jackson Steve Wesnousky Lloyd Cluff Allin Cornell Mike Blanpied David Schwartz Thomas H. Jordan (SCEC, Chair) Rufus Catchings (USGS, Menlo Park) Jill McCarthy (USGS, Golden ) Michael Reichle (CGS) CGS State of CA Working Group on California Earthquake Probabilities WGCEP ExCom Working group leadership … Ned Field (USGS, Chair) Thomas Parsons (USGS, Menlo Park) Chris Wills (CGS) Ray Weldon (U of O) Mark Petersen (USGS, Golden) Ross Stein (USGS, Menlo Park) Subcom. A Subcom. B Subcom. C … Task-oriented subcommittees Plus many others
Delivery Schedule February 8, 2006 (to CEA) UCERF 1.0 & S. SAF Assessment to CEA Aug 31, 2006 (to CEA) Fault Section Database 2.0 Earthquake Rate Model 2.0 (preliminary for NSHMP) • April 1, 2007 (to NSHMP) • Revised Earthquake Rate Model 2.x • (for use in 2007 NSHMP revision) • September 30, 2007 (to CEA) • UCERF 2 (reviewed by SRP, NEPEC, and CEPEC)
Important Lessons from Previous WGCEPs: • Everything takes longer than you expect • Some planned on innovations won’t pan out • Focus on what’s important • There will be problems with the final model • The best time to solve these problems is right away (while fresh in the mind) • Burnout makes this problematic • Thus: • Plan for both the near and long term (e.g., build a living, adaptive, extensible infrastructure)
Deploy as extensible, adaptive (living) model i.e., modifications can be made as warranted by scientific developments, the collection of new data, or following the occurrence of significant earthquakes. The model can be “living” to the extent that update & evaluation process can occur in short order. How do we plan to achieve this?
UCERF Model Components (generalization of WGCEP-2002) Fault Model(s) Black Box Deformation Model(s) Black Box Earthquake Rate Model(s) Black Box Earthquake Prob Model(s)
Object Oriented (Modular) Framework - building on OpenSHA The computer code The models &/or applications
Long-term rate of all possible events (on and off modeled faults) Fault-slip rates (at least) Time-dependent probabilities UCERF Model Components (generalization of WGCEP-2002) Fault Model(s) Black Box Deformation Model(s) Black Box Earthquake Rate Model(s) Black Box Earthquake Prob Model(s)
UCERF Model Components Fault Model(s) Black Box Instrumental Qk Catalog Deformation Model(s) Fault Section Database Historical Qk Catalog Black Box Earthquake Rate Model(s) GPS Database Black Box Paleo Sites Database Earthquake Prob Model(s)
UCERF Model Components Fault Model(s) Object Oriented (Modular) Framework Black Box Deformation Model(s) Black Box Earthquake Rate Model(s) Makes logic trees very easy to handle … Black Box Earthquake Prob Model(s)
WGCEP-2002 (10,000 branches) OpenSHAHazard Curve Calculator WGCEP-2002 Hazard Curves (Field et al. 2005, SRL) Distributed Object Technologies (Maechling et al., 2005, SRL) Now w/ NGAs & ERM 2.2 also
Issue with Logic Trees They take time and resources to implement and document Must be careful about correlations (Page and Carlson, 2006, BSSA) Is anyone using them? How do we know which are important or worth pursuing (especially in terms of loss)?
Logic Trees What we need is not all possible branches, but the minimum number of branches that span the range of viability and importance
Best Available Science? • Poisson Model (long-term rates) • Quasi-Periodic Recurrence Models • BPT Renewal • Time or Slip predictable • Static-Stress Interaction Models • Clock change • BPT-step • Rate & State • Clock change w/ Rate & State • Hardebeck (2004) approach • Empirical Rate-Change Models • Clustering Models • Foreshock/Afershock statistics (e.g., STEP; ETAS)