Download

1 / 17
170 likes | 384 Views
Gas and Power Wholesale Business. Enron North America. Financial Highlights ($ in millions). 2000. 21 Month Totals. YTD 2001. ENA ENA ENA . EBIT $ 1,330 $2,747 $4,077 Funds Flow (Pre-Tax) $ 1,389 $3,706 $5,095 Cash Flow from Ops. (Pre-Tax) $ 3,465 $1,676 $5,141 .

E N D
Gas and Power Wholesale Business Enron North America
Financial Highlights($ in millions) 2000 21 Month Totals YTD 2001 • ENA ENA ENA EBIT $ 1,330 $2,747 $4,077 Funds Flow (Pre-Tax) $ 1,389 $3,706 $5,095 Cash Flow from Ops. (Pre-Tax) $ 3,465 $1,676 $5,141 **Excludes Retail Risk Management and Prudency 2
GROSS MARGIN BY BOOK(Yr. To Date Thru October) 2000 2001 GM YTD GM SUM GAS GAS - NYMEX SWAPS DESK (2,000,000) 753,979,000 751,979,000 GAS - OPTIONS DESK 43,000,000 96,675,000 139,675,000 GAS - EAST DESK 150,000,000 5,786,000 155,786,000 GAS - CENTRAL DESK 230,000,000 181,855,000 410,855,000 GAS - WEST DESK 870,000,000 (195,162,000) 674,838,000 GAS - TEXAS DESK 220,000,000 170,341,000 390,341,000 GAS - CANADA DESK 20,000,000 (2,265,000) 17,735,000 GAS - DERIVATIVE MARKETING 30,000,000 31,032,000 61,032,000 POWER - PORTLAND POWER - WEST 460,000,000 769,562,000 1,229,562,000 POWER - MIDMARKET 40,000,000 59,679,000 99,679,000 EAST POWER - HOUSTON POWER - NORTHEAST DESK (40,000,000) 195,041,000 155,041,000 POWER - SOUTHEAST DESK 80,000,000 11,538,000 91,538,000 POWER - MIDWEST DESK 70,000,000 94,181,000 164,181,000 POWER - TEXAS 13,000,000 54,985,000 67,985,000 POWER - EAST OPTIONS DESK -- 27,795,000 27,795,000 POWER - EAST MANAGEMENT 8,000,000 46,449,000 54,449,000 POWER - CANADA POWER - ALBERTA -- 316,471,000 316,471,000 POWER - ONTARIO -- -- -- TOTALS 2,192,000,000 2,617,942,000 4,808,942,000 3
2000 Monthly Gross Margin Gas East West Total Power Power Month January 39, 957,000 (15,198,837) 23,614,000 48,372,163 February 15 ,864,000 9,287,000 28,880,000 54,031,000 March 37,433,000 (25,320,000) 37,254,000 49,367,000 April 50,297,000 13,884,000 25,398,000 89,579,000 May 220.733,000 43,119,000 75,741,000 339,593,000 June 70,671,000 15,144,000 73,681,000 159,496,000 July 15,678,000 15,760,000 15,738,000 47,176,000 August 328,792,000 24,152,000 6,411,000 359,355,000 September (62,765,000) 965,000 113.577,000 51,777,000 October 20,673,000 (26,947,000) (280,000) (6,554,000) November 421,410,000 57,026,000 67,380,000 545,816,000 December 390,146,000 16,719,000 32,786,000 439,651,000 Totals 1,548,889,000 128,590,163 500,180,000 2,177,659,163 4
2001 Monthly Gross Margin(Yr. To Date Thru October) Gas East West Alberta Total Power Power Power Month January 162,794,000 (7,385,000) 253,523,000 103,457,000 512,389,000 February 44,473,000 19,129,000 (23,431,000) (7,091,000) 33,080,000 March 375,579,000 40,810,000 136,840,000 17,295,000 570,524,000 April (138,095,000) 28,396,000 114,809,000 (6,029,000) (919,000) May (17,475,000) 180,674,000 104,753,000 (8,174,000) 259,778,000 June 479,120,000 153,503,000 27,820,000 90,696,000 751,139,000 July (43,839,000) (41,723,000) 63,733,000 7,293,000 (14,536,000) August 29,546,000 53,540,000 63,097,000 9,508,000 155,691,000 September 87,528,000 (19,249,000) 48,933,000 101,164,000 218,376,000 October (25,311,000) (41,621,000) 450,000 4,910,000 (61,572,000) November 87,921,000 63,915,000 38,714,000 3,442,000 193,992,000 YTD Totals 1,042,241,000 429,989,000 829,241,000 316,471,000 2,617,942,000 5
Enron North America Commercial Headcount 9 56 139 155 113 472 2 54 109 81 111 357 3 48 98 101 120 370 8 41 104 103 174 433 Managing Directors Vice Presidents Directors Managers Analysts & Associates TOTAL 1999 2000 1998 2001 6
Enron Americas – Value at Risk[$MM] 10-Day Moving Average 2000 Average 2001 Average 7
Enron North America Gas Transactions Per Day Non EOL EOL 2000 1997 1999 2001 1998 8
Enron North America Power Transactions Per Day Non EOL EOL 2000 1997 1999 2001 1998 9
TRANSACTIONS PER DAY TRADES PER DAY - 2000 TRADES PER DAY - 2001 TRADES PER DAY - OCTOBER 10
Enron North America Volumes Through 3rd Qtr.(Bbtue/d) Physical Gas Financial Gas Physical Power 11
Enron’s Leading Market Position Second Quarter 2000 vs Second Quarter 2001 (TBtue/d) Gas Power 2Q01 2Q00 2Q01 2Q00 13
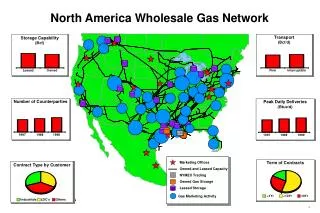
Enron North America Natural Gas and PowerTransactions in Last Year Others Top Counterparties
Enron North America Natural GasTransactions in Last Year Others Top Counterparties
Enron North America PowerTransactions in Last Year Others Top Counterparties