Download
1 / 18
180 likes | 192 Views
Inequality, Poverty and Discrimination Read Chapter 18 – pages 374-391 I Income Inequality A) A Changing Distribution of Income 1) Measuring Inequality a) Census reports the percentage of income earned by each quintile. (A quintile is 20% of the population.)

E N D
Inequality, Poverty and Discrimination Read Chapter 18 – pages 374-391 I Income Inequality A) A Changing Distribution of Income 1) Measuring Inequality a) Census reports the percentage of income earned by each quintile. (A quintile is 20% of the population.) b) A Lorenz curve shows cumulative shares of income received by individuals or groups.
c) Interpreting the Lorenz curve makes use of two references. i) The 45 degree line is where income is perfectly equal. ii) The horizontal axis followed by a vertical line at 100 percent of the households represents perfectly unequal. iii) How close the actual Lorenz curve is to either of these extremes determines whether income is considered relatively equal or relatively unequal.
B) Explaining Inequality It has been observed that over time income has become more unequal. (Note: inferring that this is more unfair is a normative statement.) Why has income become more unequal? 1) Family structure – households with two parents have 2.5 times the income on average as families with single women. It has been observed that families headed by single women have doubled since 1968.
2) Technological and Managerial change – The income gap between skilled and unskilled workers has more than doubled in percentage terms during the 1980s and 1990s. 3) Tax Policy – Tax cuts in the 1980s appear to have encouraged upper income individuals to earn more. They now not only earn more, but also pay more as percentage of total tax revenues.
II The Economics of Poverty A) Defining Poverty – Two approaches 1) Absolute income test defines a person as poor if his or her income falls below a specific income level. 2) Relative income test defines a person as poor if his or her income falls at the bottom of the income distribution. 3) The federal government uses an absolute test with a poverty line.
4) The percentage of the population that falls below the poverty line is called the poverty rate. B) The Demographics of Poverty Six characteristics of families that are importance for describing who in the US are poor. 1) Gender – Families headed by a female are three times more likely to live in poverty.
2) Age – Since children generally live in their mothers households and female headed households are more likely to be poor, so are children. 3) Education level – lower education is associated with higher poverty. 4) Employment status – non-working families have higher poverty. 5) Race – poverty is higher in black and Hispanic households. 6) Geography – Inner cities have higher rates.
C) Government Policy and Poverty 1) Welfare programs are the array of programs that government provides to alleviate poverty. a) Temporary Assistance for Needy Families (TANF). b) Food stamps. c) rent vouchers. d) Medicaid
2) Cash versus Noncash Assistance a) Cash assistance is money payment that a recipient can spend as he or she wishes. b) Noncash assistance is the provision of specific goods and services such as food or medical services or job training rather than cash.
D) Welfare Reform The Personal Responsibility and Work Opportunity Reconciliation Act of 1996 was designed to move people from welfare to work.
E) Explaining Poverty 1) Although poverty falls during expansions, it does not appear to be as significantly affected. 2) Although welfare programs do bring up the level of income for the poor, it does always bring them out of poverty. 3) The following chart, exhibit 18-7, shows that it will be hard for the welfare changes in 1996 to have a major impact since only about 1/10 of those in poverty could potentially be moved to full time work.
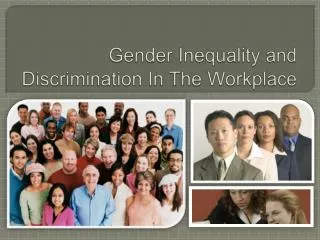
III The Economics of Discrimination A) Discrimination occurs when people with similar economic characteristics experience different economic outcomes because of their race, gender, or other noneconomic characteristics. B) Discrimination in the Marketplace: A Model. The following graph shows that when employers have discriminatory attitudes towards black employees that fewer are hired and their wage rate is lower.
C) Sources of Discrimination: 1) views about productivity; 2) views that other workers will need to be paid more to work with someone undesirable; 3) views that customers of a firm are less willing to buy from a particular type of person.
D) Discrimination in the United States today. Numerous legislative acts have been passed to curtail discrimination. Although discrimination has been reduced, black men earn roughly 73 cents for every dollar earned by a white man, white females earn 75 cents for every dollar earned by a white man, and black women earn 63 cents for every dollar earned by a white man. One problem with these statistics is that they do not control for other factors such as education, job experience.