Download
1 / 54
550 likes | 737 Views
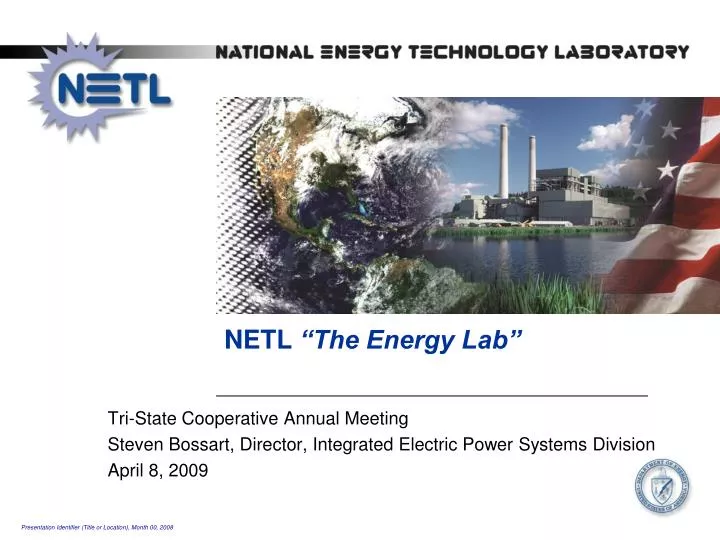
NETL “The Energy Lab”. Tri-State Cooperative Annual Meeting Steven Bossart, Director, Integrated Electric Power Systems Division April 8, 2009. Agenda. NETL Background NETL Smart Grid Activities What is a Smart Grid? Smart Grid and ARRA Electric Grid R&D Projects

E N D
NETL “The Energy Lab” Tri-State Cooperative Annual Meeting Steven Bossart, Director, Integrated Electric Power Systems Division April 8, 2009
Agenda NETL Background NETL Smart Grid Activities What is a Smart Grid? Smart Grid and ARRA Electric Grid R&D Projects Clean Coal in a Smart Grid Future Cooperatives and Municipals Questions
About NETL Oregon Pennsylvania West Virginia
R. Boyle, 01/06/2009 National Energy Technology Laboratory • Research spans fundamental science to technology demonstrations in Fossil Energy, Energy Efficiency, and Electricity Delivery and Energy Reliability • Only government-owned and government-operated DOE national laboratory • One lab, three research sites, five locations • >1,200 Federal and support-contractor employees • Internal and external R&D programs Where Energy Challenges Converge and Energy Solutions Emerge
Energy Strategy Complexity Need to Consider All Major Consequences of Energy Strategy Must Aim for Balanced Solutions
U.S. data from EIA, Annual Energy Outlook 2009 early release ; world data from IEA, World Energy Outlook 2008 Energy Demand 2030 113 QBtu / Year79% Fossil Energy + 13% 675 QBtu / Year 81% Fossil Energy + 45% Energy Demand 2006 100 QBtu / Year85% Fossil Energy United States 465 QBtu / Year 81% Fossil Energy World Fossil Energy Continues to Provide Vast Majority of Supply
FERC, “Increasing Costs in Electric Markets,” June 19, 2008 Capital Cost Uncertainty, FERC NETL 2007 baseline NETL 2008 estimates, with capture
Project Management CenterNon-Fossil Infrastructure and Energy Activities • Energy Efficiency & • Renewable Energy • Vehicle technologies • Building technologies • Industrial technologies • Weatherization & state energy programs • Electricity Delivery & Energy Reliability • Grid modernization • Reliable & secure energy supplies • Disaster response
Smart Grid Supports 21st-Century Demand The grid of the last century: large, centralized plants ship power in one direction — to the customer The modern grid incorporates new centralized plants with renewables, distributed generation, “aggregated” backup generators, energy storage, and demand-response programs — seamlessly and safely
NETL’s Work on Smart Grid Overview of NETL Modern Grid Strategy Project What is the Smart Grid? R&D Electric Grid Projects High-Temperature Superconductivity Renewable and Distributed Systems Integration Visualization and Controls Energy Storage and Power Electronics Smart Grid Maturity Model Smart Grid Clearinghouse Federal Smart Grid Task Force WV Smart Grid Implementation Plan project Smart Grid ARRA projects
The Modern Grid Strategy (MGS) Policy of US to support modernization of the electricity grid (EISA of 2007, Title XIII, Section 1301) DOE Office of Electricity Delivery and Energy Reliability is committed to leading a national effort to accomplish it The National Energy Technology Lab is conducting the MGS – independent and neutral – previously known as the Modern Grid Initiative MGS Mission – Accelerate modernization of the national grid
Role of the MGS • Define a vision for the Modern Grid • Reach out to stakeholders to gain consensus • Assist in identification and resolution of barriers & issues • Promote testing of integrated suites of technologies • Assist states with grid modernization • Communicate success stories to stimulate deployment
Smart Grid Principal Characteristics The Smart Grid is “trans-active” and will: Enableactive participation by consumers Accommodate all generation and storage options Enable new products, services and markets Provide power quality for the digital economy Optimize asset utilization and operate efficiently Anticipate & respondto system disturbances (self-heal) Operate resiliently against attack and natural disaster
It will “Enable active participation by consumers” Consumers have access to new information, control and options to engage in electricity markets See what they use, when they use it, and what it costs Manage energy costs Investment in new devices Sell resources for revenue or environmental stewardship Grid operators have new resource options Reduce peak load and prices Improve grid reliability 16 16
It will “Accommodate all generation and storage options” Seamlessly integrates all types and sizes of electrical generation and storage systems “Plug-and-play” convenience Simplified interconnection processes Universal interoperability standards Number of smaller, distributed sources will increase – shift to a more decentralized model Large central power plants will continue to play a major role. 17 17
It will “Enable new products, services and markets” Links buyers and sellers – consumer to power supplier Supports the creation of new electricity markets PHEV and vehicle to grid Brokers, integrators, aggregators, etc. New commercial goods and services Provides for consistent market operation across regions 18 18
It will “Provide power quality for the digital economy” Monitors, diagnoses and responds to PQ issues Supplies various grades of power quality at different pricing levels Greatly reduces consumer losses due to PQ (~$25B/year) Quality Control for the grid 19 19
It will “Optimize asset utilization and operate efficiently” Operational improvements Improved load factors and lower system losses Integrated outage management Risk assessment Asset Management improvements The knowledge to build only what we need Improved maintenance processes Improved resource management processes More power through existing assets Reduction in utility costs (O&M and Capital) 20 20
Electric Power System Utilization% Asset Utilization 47% Generation 50% Transmission 30% Distribution <1% Consumer Systems
It will “Anticipate & respond to system disturbances” Performs continuous self-assessments Detects, analyzes, responds to, and restores grid components or network sections Handles problems too large or too fast-moving for human intervention Self heals - acts as the grid’s “immune system” Supports grid reliability, security, and power quality 22 22
It will “Operate resiliently against attack and natural disaster” System-wide solution to physical and cyber security Reduces threat, vulnerability, consequences Deters, detects, mitigates, responds, and restores “Fort Knox” image Decentralization and self-healing enabled 23 23
Smart Grid Key Success Factors The Smart Grid is MORE: Reliable Secure Economic Efficient Environmentally friendly Safe
Integration Science & Technology Smart Grid Technologies Integration – biggest gap in today’s science & technology development
Smart Grid Key Technology Areas • Smart meters • Smart sensors • Operating parameters • Asset Condition • Wide area monitoring systems (WAMS) • Dynamic rating of transmission lines
Smart Grid Key Technology Areas Applications that: • Monitor and collect data from sensors • Analyze data to diagnose and provide solutions • Real time and predictive • Determine and take action autonomously or via operators • Provide information and solutions to operators • Integrate with enterprise-wide processes and technologies
Smart Grid Key Technology Areas Next generation FACTS/PQ devices Advanced distributed generation and energy storage PHEV - V2G mode Fault current limiters Superconducting transmission cable & rotating machines Microgrids Advanced switches and conductors
Smart Grid Key Technology Areas Data reduction Data to information to action Visualization Speed of comprehension System operator training
Smart Grid Key Technology Areas Smart meters Smart sensors Demand Response DG dispatch Distribution automation Micro-grids Markets Work force management Mobile premises (PHEV’s)
Value Proposition Cost to Modernize $165B over 20 years $127B for Distribution $38B for Transmission ~$8.3B per year(incremental to business-as-usual) Current annual investment - $18B (Source: EPRI, 2004) Benefit of Modernization $638B - $802B over 20 years Overall benefit to cost ratio is 4:1 to 5:1
Generally speaking… Generally Speaking Advanced Transmission Operations (Advanced Asset Management) Benefit Advanced Distribution Operations Advanced Metering Infrastructure Cost 34
Utility Benefits Operational improvements Metering and billing Outage management Process improvement Work force management Reduced losses (energy) Asset utilization Asset Management improvements System planning Maintenance practices Engineering These benefits are expected to improve customer satisfaction and reduce O&M and capital costs.
Consumer Benefits Improved reliability Improved overall level of service Access to information Ability to manage energy consumption Option to participate in demand response Convenient interconnection of distributed generation Option to bid (sell) into electricity markets Potential to dramatically reduce transportation costs (PHEV) Consumers have access to information, control and options
Societal Benefits Downward pressure on electricity prices through improved operating and market efficiencies, consumer involvement Improved reliability leading to reduction in consumer losses (~$135B) Increased grid robustness improving grid security Reduced emissions through integration of renewable generation and reduced losses New jobs and growth in GDP Opportunity to revolutionize the transportation sector through integration of electric vehicles as generation and storage devices Societal benefits must be included in the value proposition
Barriers to the Smart Grid Insanity is defined as doing the same old thing expecting a different result.
Change Management A significant change management effort is needed: Why do we need to change? What is the vision? What is the value proposition? 300 Million consumers affected Consumer education, alignment and motivation is critical Metrics needed for accountability and to monitor progress Active leadership by stakeholder groups needed Our challenge is to align under a common long term vision and make our short term investment decisions consistent with the “end in mind”.
Regulatory Time based rates - incentives for consumers to become actively involved Favorable depreciation rules – recovery of book value for assets that are retired early for “smart grid” reasons Policy changes that provide incentives and remove disincentives to utilities – investment in a Smart Grid should make business sense Clear cost recovery policies - uncertain cost recovery increases investment risk Societal benefits – quantified and included in business cases New regulatory models
Technical Incorporating 2-way power flow into operations Simplifying interconnection standards while maintaining safety Getting the communications system right Integration of disruptive technologies Sharing successes and “lessons learned” Need a “real” electricity market Lack of resources to “change” and also “keep the lights on” Shortage of skilled human resources More focus on R&D – breakthrough technologies
American Recovery & Reinvestment ActKey Energy Stimulus • Energy Efficiency and Renewable Energy ($16.8B) • Energy Efficiency and Conservation Block Grants ($3.2B) • Weatherization Assistance ($5B) • State Energy Program ($3.1B) • Advanced Batteries ($2B) • Electricity Delivery and Energy Reliability ($4.5B) • EISA 2007 Title XIII • Worker training • Development of regional transmission plans • Development of interoperability standards for Smart Grid devices • Fossil Energy R&D ($3.4B) • Advanced Research Projects Agency – Energy ($0.4B) • Innovative Technology Loan Guarantee Program ($6B)
Electric Grid R&D Projects • Renewable and Distributed Systems Integration • Storage and Power Electronics • High-Temperature Superconductivity • Visualization and Controls
RDSI Program • Develop technologies, tools, and techniques to integrate load management and DER • Develop and demonstrate Smart Grid technologies in an integrated and intelligent T&D network • Advance integration technologies to access renewable energy sources • Demonstrate DER to decrease peak load, increase asset utilization, and defer electric system upgrades • NETL is managing nine RDSI projects • $55M of DOE funds over 5 years; total is >$100M • Primary goal is to use DER to reduce peak load by 15% • DER (storage and DG), DR, Communications, Automation
Fort Collins Project Scope • Demonstrate the monitoring, aggregation, integration, dispatch, and verification of distributed generation, renewable energy, and demand response resources • Reduce peak loading in the range of 20-30% on two feeders within Fort Collins Utilities’ electric distribution network • Demonstrate Intentional Islanding and Import/Export capabilities • R&D covering advanced mixed-fuel control systems, adapting Plug-in Hybrid Vehicles to the grid, fuel cell integration, on-site energy management, etc.
Fort Collins DER Integration New Belgium Brewing DER Asset Overview DER Network Operating System Configuration Fort Collins Team 13 members
West Virginia Smart Grid Implementation Plan • $540K project jointly funded by NETL, RDS, Allegheny Power, AEP, State of West Virginia, WVU, and DOE OE • Results will describe approach and value proposition of implementing Smart Grid in West Virginia • Cost & benefit analysis comparing state of current electricity grid and future Smart Grid in West Virginia • Address role of coal in Smart Grid • Support economic development in West Virginia • Establishes WV and NETL as leaders in Smart Grid • Only state-wide Smart Grid implementation plan • Only second Smart Grid study to be published
Other NETL Smart Grid Activities • Smart Grid Maturity Model • Roadmap of activities, investments, and best practices • Measures progress and level of achieving Smart Grid • Smart Grid Clearinghouse • First-stop website for public information on Smart Grid • Technologies, tests and demonstrations, business cases, cost & benefits, best practices, legislation • Federal Smart Grid Task Force • Multi-agency task force created by Title XIII of EISA 2007 • DOE (OE&EE), NIST, DOD, USDA, DHS, EPA, FERC • Smart Grid and Clean Coal Relationship
Common Factors Smart Grid and electricity generation from Clean Coal Technology support energy independence for the US. Both support holding the line against rising electric prices. A Smart Grid helps the US Clean Coal Strategy by closing the gap between generation capacity and electricity supply which increases the importance of coal as a baseload resource, and closing this gap frees up capital investment needed to finance clean coal technology, emission projects including carbon management, and baseload coal generation plants There are several key facts that present an interesting situation to explore. Coal is a domestic resource. The Smart Grid is a domestic resource. From an energy independence perspective, a clean coal future is necessary and sustainable.