Download
1 / 38
380 likes | 390 Views
ELEC 7770 Advanced VLSI Design Spring 2016 Yield, Quality and Moore’s Law. Vishwani D. Agrawal James J. Danaher Professor ECE Department, Auburn University Auburn, AL 36849 vagrawal@eng.auburn.edu http://www.eng.auburn.edu/~vagrawal/COURSE/E7770_Spr16/course.html. VLSI Chip Yield.

E N D
ELEC 7770Advanced VLSI DesignSpring 2016Yield, Quality and Moore’s Law Vishwani D. Agrawal James J. Danaher Professor ECE Department, Auburn University Auburn, AL 36849 vagrawal@eng.auburn.edu http://www.eng.auburn.edu/~vagrawal/COURSE/E7770_Spr16/course.html ELEC 7770: Advanced VLSI Design (Agrawal)
VLSI Chip Yield • A manufacturing defect is a finite chip area with electrically malfunctioning circuitry caused by errors in the fabrication process. • A chip with no manufacturing defect is called a good chip. • Fraction (or percentage) of good chips produced in a manufacturing process is called the yield. Yield is denoted by symbol Y. ELEC 7770: Advanced VLSI Design (Agrawal)
Importance of Yield • Cost of a chip = Cost of fabricating and testing a wafer Yield × Number of chip sites on the wafer ELEC 7770: Advanced VLSI Design (Agrawal)
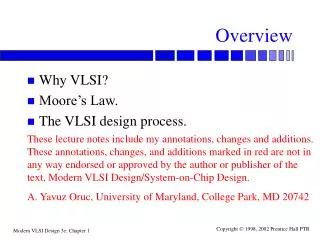
Clustered VLSI Defects Good chips Faulty chips Defects Wafer Clustered defects (VLSI) Wafer yield = 17/22 = 0.77 Unclustered defects Wafer yield = 12/22 = 0.55 ELEC 7770: Advanced VLSI Design (Agrawal)
Yield Parameters • Defect density (d ) = Average number of defects per unit chip area • Chip area (A ) • Clustering parameter (a) • Negative binomial distribution of defects, p (x ) = Prob(number of defects on a chip = x ) Γ(α+x ) (Ad / α) x = . x ! Γ (α) (1+Ad / α) α+x where Γis the gamma function α = 0, p (x ) is a delta function (max. clustering) α = , p (x ) is Poisson distribution (no clustering) ELEC 7770: Advanced VLSI Design (Agrawal)
Yield Equation Y = Prob( zero defect on a chip ) = p (0) Y = ( 1 + Ad / α ) – α Example: Ad = 1.0, α = 0.5, Y = 0.58 Unclustered defects: α = ,Y = e – Ad Example: Ad = 1.0, α = , Y = 0.37 too pessimistic ! ELEC 7770: Advanced VLSI Design (Agrawal)
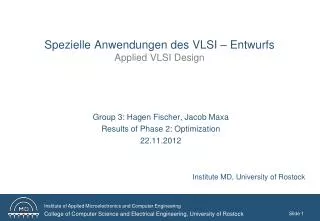
Effect of Defect Clustering 1.00 0.75 0.50 0.25 0.00 Ad = 0.5 e-0.5 = 0.607 Yield 0 0.5 1.0 1.5 2.0 Clustering Parameter, α ELEC 7770: Advanced VLSI Design (Agrawal)
Ranges of Yield Parameters 5.0 0.5 Yield of 1 cm2 chip 0.906 0.27 Initial process Mature process Clustering parameter, α 0.913 0.50 0.1 1.5 Defect density, d in defects per cm2 ELEC 7770: Advanced VLSI Design (Agrawal)
References • Clustered yield model • M. L. Bushnell and V. D. Agrawal, Essentials of Electronic Testing for Digital, Memory and Mixed-Signal VLSI Circuits, Springer, 2000, Chapter 3. • C. H. Stapper, “On Yield, Fault Distributions, and Clustering of Particles,” IBM Jour. of Res. and Dev., vol. 30, no. 3, pp. 326-338, May 1986. • The unclustered defect model was first described in paper: • B. T. Murphy, “Cost-Size Optima of Monolithic Integrated Circuits,” Proc. IEEE, vol. 52, no. 12, pp. 1537-1545, December 1964. • A general reference on clustered distributions: • A. Rogers, Statistical Analysis of Spatial Dispersions, London, United Kingdom: Pion Limited, 1974. ELEC 7770: Advanced VLSI Design (Agrawal)
Defect Level or Reject Ratio • Defect level (DL) is the ratio of faulty chips among the chips that pass tests. • DL is measured as parts per million (ppm). • DL is a measure of the effectiveness of tests. • DL is a quantitative measure of the manufactured product quality. For commercial VLSI chips a DL greater than 500 ppm is considered unacceptable. ELEC 7770: Advanced VLSI Design (Agrawal)
Determination of DL • From field return data: Chips failing in the field are returned to the manufacturer. The number of returned chips normalized to one million chips shipped is the DL. • From test data: Fault coverage of tests and chip fallout rate are analyzed. A modified yield model is fitted to the fallout data to estimate the DL. ELEC 7770: Advanced VLSI Design (Agrawal)
Testing and Defect Level 100 60 0 Test yield = 62% True yield = 60% Percentage of chips passing test Defect level = 32,258 PPM Testing stopped 0 moderate high Testing cost ELEC 7770: Advanced VLSI Design (Agrawal)
Test Data Analysis for DL • Define three parameters: • Fault density, f = average number of stuck-at faults per unit chip area • Fault clustering parameter, b • Stuck-at fault coverage, T • New yield parameters: • d → f, Ad → TAf • α → b ELEC 7770: Advanced VLSI Design (Agrawal)
Fault-Based Yield Equation Replace defects with modeled faults: Y(T ) = (1 + TAf / b) – b Assume that tests with 100% fault coverage (T = 1.0) will remove all faulty chips, Y = Y (1) = (1 + Af / b) – b ELEC 7770: Advanced VLSI Design (Agrawal)
Defect Level Y (T ) – Y (1) DL (T ) = ——————— Y (T ) ( b + TAf ) b = 1 – —————— ( b + Af ) b Where T is the fault coverage of tests, Af is the average number of faults on the chip of area A, β is the fault clustering parameter. Af and β are determined by test data analysis. ELEC 7770: Advanced VLSI Design (Agrawal)
Example: SEMATECH Chip • Bus interface controller ASIC fabricated and tested at IBM, Burlington, Vermont • 116,000 equivalent (2-input NAND) gates • 304-pin package, 249 I/O • Clock: 40MHz, some parts 50MHz • 0.8m CMOS, 3.3V, 9.4mm x 8.8mm area • Full scan, 99.79% fault coverage • Advantest 3381 ATE, 18,466 chips tested at 2.5MHz test clock • Data obtained courtesy of Phil Nigh (IBM) ELEC 7770: Advanced VLSI Design (Agrawal)
Test Coverage from Fault Simulator Stuck-at fault coverage, T Vector number ELEC 7770: Advanced VLSI Design (Agrawal)
Measured Chip Fallout Measured chip fallout, 1 – Y (T ) Vector number ELEC 7770: Advanced VLSI Design (Agrawal)
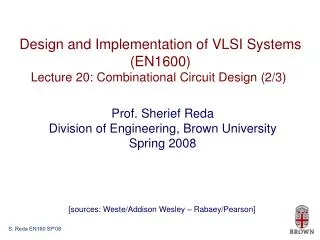
Model Fitting Chip fallout vs. fault coverage Y (1) = 0.7623 Chip fallout and computed 1 – Y (T ) Measured chip fallout Y (T ) for Af = 2.1 and b = 0.083 Stuck-at fault coverage, T ELEC 7770: Advanced VLSI Design (Agrawal)
Computed DL 237,700 ppm (Y = 76.23%) Defect level in ppm Stuck-at fault coverage (%) ELEC 7770: Advanced VLSI Design (Agrawal)
Summary • VLSI yield depends on two process parameters, defect density (d ) and clustering parameter (α). • Yield drops as chip area increases; low yield means high cost. • Fault coverage measures the test quality. • Defect level (DL) or reject ratio is a measure of chip quality. • DL can be determined by an analysis of test data. • For high quality: DL << 500 ppm, fault coverage ~ 99% ELEC 7770: Advanced VLSI Design (Agrawal)
Two Problems to Solve • Using the expression for defect level on Slide 15, derive test coverage (T ) as a function of fault clustering parameter (β), defect level (DL), and average number of faults (Af) on a chip. • Find the defect level for: • Fault density, f = 1.45 faults/sq. cm • Fault clustering parameter, β = 0.11 • Chip area = 1 cm2 • Fault Coverage, T = 95% ELEC 7770: Advanced VLSI Design (Agrawal)
Solution to Problem 1 Defect level, DL, is given on Slide 15, as follows: DL = 1 – [(β + TAf )/(β + Af )]β where T is the fault coverage, Af is the average number of faults on a chip of area A, and β is a fault clustering parameter. Further manipulation of this equation leads to the following result: (1 – DL)1/β = (β + TAf )/(β + Af ) or T = [{(β + Af )(1 – DL)1/β– β}/(Af )] × 100 percent ELEC 7770: Advanced VLSI Design (Agrawal)
Solution to Problem 2 Defect level, DL, as given on Slide 15, is: DL(T ) = 1 – [(β + TAf )/(β + Af )]β Substituting, • Fault density, f = 1.45 faults/sq. cm • Fault clustering parameter, β = 0.11 • Chip area = 1 cm2 • Fault Coverage, T = 95% We get, DL(T ) = 0.00522 or 5,220 parts per million ELEC 7770: Advanced VLSI Design (Agrawal)
Gordon E. Moore ELEC 7770: Advanced VLSI Design (Agrawal)
1965 • “Cramming More Components onto Integrated Circuits,” Electronics, vol. 38, no. 8, April 19, 1965. • The complexity for minimum component costs has increased at a rate of roughly a factor of two per year (see graph on next page). Certainly over the short term this rate can be expected to continue, if not to increase. Over the longer term, the rate of increase is a bit more uncertain, although there is no reason to believe it will not remain nearly constant for at least 10 years. That means by 1975, the number of components per integrated circuit for minimum cost will be 65,000. I believe that such a large circuit can be built on a single wafer. ELEC 7770: Advanced VLSI Design (Agrawal)
Moore’s 1965 Graph Shrinking features Increase defect density Components per unit area Increased by reducing Feature size 1975 Shrinking feature size → ELEC 7770: Advanced VLSI Design (Agrawal)
Economics of VLSI • Assume wafer size and processing cost are fixed. • Increasing chip area will: • Reduce number of chips on a wafer • Reduce yield • Increase chip cost Cost of fabricating and testing a wafer Chip cost = Yield × Number of chip sites on the wafer • Increase functionality also • Cost per function should be minimized. ELEC 7770: Advanced VLSI Design (Agrawal)
Increasing Functionality/Area • Increase number of transistors per unit area: • Shrink feature size (λ) • Each generation of VLSI technology reduces λ by a factor 1/√2 = 0.707, doubling number of transistors per unit area • Assume defect density d = k/λ, where k is a constant of proportionality (technology parameter) • Area of a component (transistor) is k’λ, where k’ is a constant (technology parameter) • On chip of area A, number of transistors t = A/(k’λ) ELEC 7770: Advanced VLSI Design (Agrawal)
Component (Transistor) Cost, Ct Ct = Chip cost/Number of transistors Wafer cost (Wc) k’λ = ̶ ̶ ̶ ̶ ̶ ̶ ̶ ̶ ̶ ̶ ̶ ̶ ̶ ̶ ̶ ̶ ̶ ̶ ̶ ̶ ̶ ̶ ̶ ̶ ̶ ̶ ̶ ̶ ̶ ̶ ̶ ̶ ̶ ̶ ̶ ̶ ̶ ̶ . ̶ ̶ ̶ ̶ ̶ ̶ Y × Wafer area (Wa)/A A Wc k’λWc = ̶ ̶ ̶ ̶ ̶ ̶ ̶ ̶ ̶ ̶ ̶ ̶ ̶ ̶ ̶ ̶ ̶ ̶ ̶ ̶ ̶ ̶ ̶ ̶ ̶ ̶ ̶ ̶ ̶ = ̶ ̶ ̶ ̶ ̶ ̶ k’λ (1 + kk’t / a)a Wa (1 + Ad/ a) – a Wa ELEC 7770: Advanced VLSI Design (Agrawal)
Component Cost k’λ Cost per transistor (1 + kk’t / a)a Number of transistors, t → ← λ ELEC 7770: Advanced VLSI Design (Agrawal)
Technology Advances Decreasing k k’λ Cost per transistor (1 + kk’t / a)a Number of transistors, t → ← λ ELEC 7770: Advanced VLSI Design (Agrawal)
1975 • “Progress in Digital Integrated Electronics,” IEDM Tech. Digest, 1975, pp. 11-13. • . . . the rate of increase of complexity can be expected to change slope in the next few years as shown in Figure 5. The new slope might approximate a doubling every two years, rather than every year, by the end of the decade. ELEC 7770: Advanced VLSI Design (Agrawal)
Figure 5 of Moore’s 1975 Paper 16M 1M 64K 4K 256 16 1 Components per chip 60 65 70 75 80 85 Year ELEC 7770: Advanced VLSI Design (Agrawal)
1995 • “Lithography and the Future of Moore’s Law,” Proc. SPIE, vol. 2437, May 1995. • By making things smaller, everything gets better simultaneously. There is little need for trade-offs. The speed of our products goes up, the power consumption goes down, system reliability, as we put more of the system on a chip, improves by leaps and bounds, but especially the cost of doing thing electronically drops as a result of the technology. (SPIE – Society of Photonic Instrumentation Engineers) ELEC 7770: Advanced VLSI Design (Agrawal)
Also in the 1995 Paper . . . I have no idea what will happen beyond 0.18 microns. In fact, I still have trouble believing we are going to be comfortable at 0.18 microns using conventional optical systems. Beyond this level, I do not see any way that conventional optics carries us any further. Of course, some of us said this about the one micron level. This time, however, I think there are fundamental materials issues that will force a different direction. The people at this conference are going to have to come up with something new to keep us on the long term trend. ELEC 7770: Advanced VLSI Design (Agrawal)
Moore’s Law Source: Wikipedia ELEC 7770: Advanced VLSI Design (Agrawal)
2016 • Problems arising with technology advances: • High power consumption • Power density • Leakage • Process variation – larger as a fraction of feature size • Increased noise sensitivity • Problems with design: • Verification of correctness – logic and timing • Ensuring reliable operation • Testing complexity – time and cost ELEC 7770: Advanced VLSI Design (Agrawal)