Download
1 / 16
160 likes | 165 Views
This workshop focuses on analyzing the effects of ice removal and sea level rise on the physiography of Antarctica using spatial analysis of raster data. Students will learn various techniques and tools in GIS to explore, map, visualize, and analyze the data.

E N D
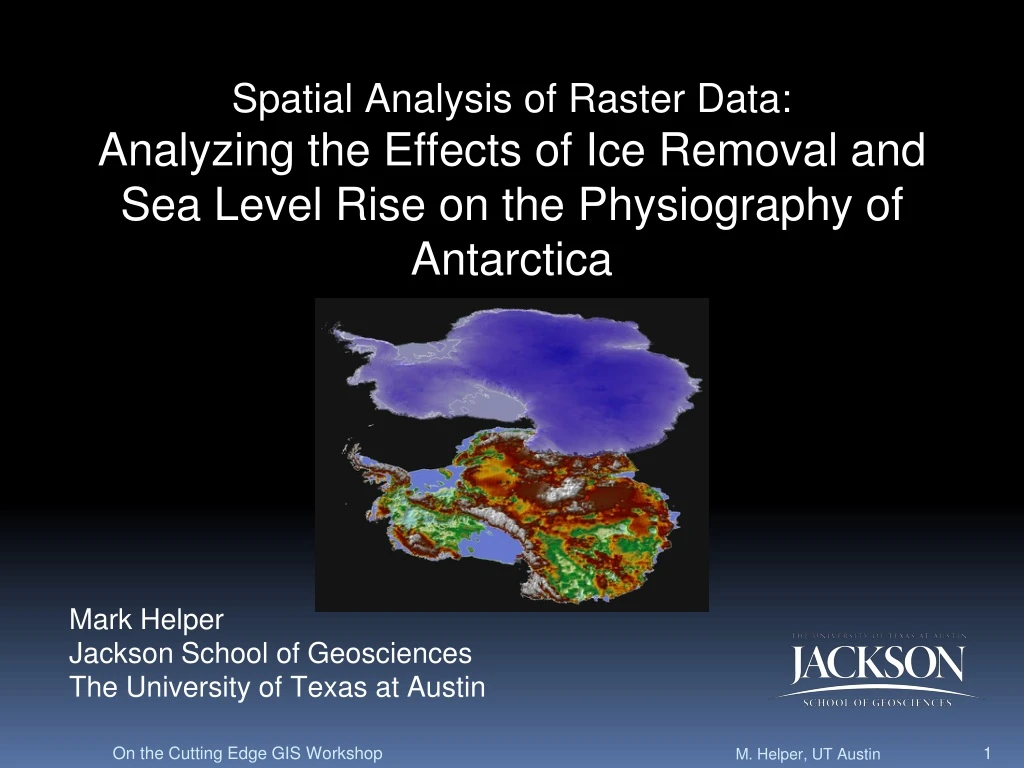
Mark Helper Jackson School of Geosciences The University of Texas at Austin Spatial Analysis of Raster Data: Analyzing the Effects of Ice Removal and Sea Level Rise on the Physiography of Antarctica On the Cutting Edge GIS Workshop
GIS/GPS Applications in Earth SciencesCourse and Students: • Only GIS class in the Department • Senior elective, cross listed as Grad. Course • 20 students, TA • 3 hrs. lecture, 2 hrs. lab per week • Prerequisite - intro. field geology with 3 hr expose to GIS base map prep., GPS data collection On the Cutting Edge GIS Workshop
Context: • First Lab with Raster Data Sets • Previous Labs/Lectures • Data Models – raster, vector • Projections • Digitizing, Georeferencing • ArcMap/Catalog basic • Preparation for Course Project On the Cutting Edge GIS Workshop
Raster Techniques/Tools: • Masking • Classifying and Symbolizing • Hillshade and Contour • Raster Calculations On the Cutting Edge GIS Workshop
Analysis Skills: • Raster Query Strategies • Highest/Lowest Elevations • Elevation at a point • Raster Statistics • Comparing Rasters • Raster Overlay • Land vs. Water • Area and Volume Calculations • Ice Sheet Properties On the Cutting Edge GIS Workshop
Focus Questions: • Q1: What is the mean, maximum and minimum elevation of Antarctica? • Q2: What does Antarctica presently look like beneath the ice? • Q3: How much ice is there? • Q4: What would a “Greenhouse” Antarctica look like? On the Cutting Edge GIS Workshop
Tools and Data • Tools – ArcGIS 9.x • Spatial Analyst (required) • 3-D Analyst (optional; area and volume calculation) • Data – SCAR and BEDMAP sources • Posted for download as ~27 Mb Zip file On the Cutting Edge GIS Workshop
Vector Data - Coverages • Point • South Pole • Arcs • Continent outline • Contours • Polygons • Land • Ice Shelves/Tongues On the Cutting Edge GIS Workshop
4.4 km 4.4 km :-2.6 km Raster Data (5x5 km ESRI Grids) Surface Elevation Bedrock Elevation(masked) Ice Thickness 4.5 km 0 m On the Cutting Edge GIS Workshop M.S.L.
Strategy:Explore, Map, Visualize, Analyze • Explore – Raster Properties, Metadata • Map/Visualize – Overlay and Symbolize • Analyze - Query and Model Questions basic to each step are inserted along the way On the Cutting Edge GIS Workshop
Explore the Data • Resolution • Data type • File size • Spatial Reference • Raster Stats. e.g. Q1: What are mean, max. min. elevations? On the Cutting Edge GIS Workshop
Explore the Data:Classify Elevations • Equal interval, 200m On the Cutting Edge GIS Workshop
Analysis Skills:Simple Raster Calculations • Conditional Statements and Binary Rasters Con([bed_elev] <= 0,1) Bedrock Elevation Above or Below MSL On the Cutting Edge GIS Workshop
Map/Visualize:Q2: What does Antarctica look beneath the ice? • Overlay binary raster with other layers and create a shoreline contour = Bedrock Elevation Above or Below MSL On the Cutting Edge GIS Workshop
Final Analysis:Q4: What would “Greenhouse” Antarctica look like? Calculate new bedrock elevation raster that accounts for isostatic rise from ice removal; Subtract from this new raster elevations equivalent to a higher sea level (~80 m); Overlay a new binary land/sea raster Elevation change = (Density of ice / Density of Mantle) x (ice thickness) On the Cutting Edge GIS Workshop
Final Analysis: Prepare and Compare Final Maps Bedrock Elevation Today Bedrock ElevationGreenhouse Conditions On the Cutting Edge GIS Workshop