Download
1 / 24
240 likes | 396 Views
The 12 th Annual Report on the Conditions of Children in Orange County. 2006. Sponsored by the Children’s Services Coordination Committee. Produced by: Orange County Social Services Agency Children and Families Commission of OC Orangewood Children’s Foundation

E N D
The 12th AnnualReport on theConditions of Childrenin Orange County 2006
Sponsored by the Children’s Services Coordination Committee Produced by: • Orange County Social Services Agency • Children and Families Commission of OC • Orangewood Children’s Foundation • Center for Community Collaboration at California State University, Fullerton • Orange County Health Needs Assessment
Purpose of the Forum To create a better awareness about the conditions of children in Orange County. To consider and discuss SO WHAT?
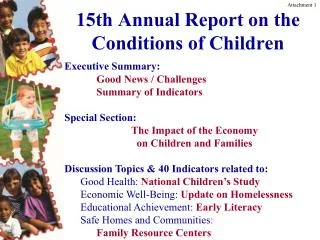
12th Annual Report on the Conditions of Children Executive Summary: • Good News / Challenges / Summary of Indicators Special Section: • Children’s Oral Health Discussion Topics and 39 Indicators related to: - Good Health – Immunizations - Economic Well-Being – Self Sufficiency - Educational Achievement – Alternative Education - Safe Homes and Communities – Wraparound
Children’s DemographicsTotal Population: 846,604 231,928 216,014 204,119 194,543 AGE DISTRIBUTION
Hispanic White Asian Other Black Children’s Demographics Orange County’s Children Population 0-17 Years by Race/Ethnicity, 1990, 2000 & 2010 (projected) by race/ethnicity 1990 2000 2010
GOOD HEALTH Discussion Topic Immunization GOOD HEALTH (page 30)
Enrollment in Health Care Program Medi-Cal, Healthy Families, California Kids and Kaiser Permanente 252,689 GOOD HEALTH (page 36)
Prenatal Care Percent Receiving Early Prenatal Care 1994 to 2003 GOOD HEALTH (page 38)
ECONOMIC WELL-BEING Discussion Topic Self-Sufficiency ECONOMIC WELL-BEING (page 62)
Cal WorksEconomic Well-Being Children Receiving Financial Assistance Through CalWORKs, 1995/96 to 2004/05 ECONOMIC WELL-BEING (page 62)
Free and Reduced Lunch Districts with HIGHEST and LOWEST percent of students receiving free and reduced lunch ECONOMIC WELL-BEING (page 70)
ACADEMIC ACHIEVEMENT Discussion Topic Alternative Education ACADEMIC ACHIEVEMENT (page 80)
Education DataTotal Public School Enrollment1995/96 through 2004/05 515,464 503,351 510,114 483,360 458,489 442,927 ACADEMIC ACHIEVEMENT (page 85)
Total Public School Enrollment vs. English Learners 1995/96 to 2004/05 ACADEMIC ACHIEVEMENT (page 90)
Academic Performance Index Districts with Highest Percentage of API Improvement, 1999 to 2005 ACADEMIC ACHIEVEMENT (page 86)
Average per Pupil Expenditure Average Dollar Expenditure Per Pupil for Grades K-12, 1995/96 to 2004/05 ACADEMIC ACHIEVEMENT (page 92)
SAFE HOMES AND COMMUNITIES Discussion Topic Wraparound SAFE HOMES AND COMMUNITIES (page 102)
Dependent Children Average Monthly Number of Children in Out-of-Home Care and the Average Monthly Number of Dependents of the Court, 1995/96 to 2004/05 SAFE HOMES AND COMMUNITIES (page 112)
Emancipation Services Monthly Average Number of Youth Served 2001/01 to 2004/05 SAFE HOMES AND COMMUNITIES (page 116)
Juvenile Arrests Total Juvenile Arrests for Youth 10 to 17 Years of Age, 1995 to 2004 SAFE HOMES AND COMMUNITIES (page 120)
So What? • What are the implications of the data? • What explains the trends? • What is the impact on policy? • What are the budgetary implications? • What are the challenges for the future? • How should the community respond to the information? • Where should priorities be focused?
THANK YOU TO ALL THE CONTRIBUTORS TO THE PRODUCTION OF THE 12TH ANNUAL REPORT
Welcome Katelyn and Kelly Reed Special Guests