Download
1 / 20
200 likes | 354 Views
A Custom Projection for Lake Powell Designed Using ArcGIS. Dave Minkel, National Geodetic Survey Michael Dennis, Geodetic Analysis, LLC Lex Newcomb, National Park Service. Presentation Outline. Describe a custom projection (i.e. low distortion projection)

E N D
A Custom Projection for Lake Powell Designed Using ArcGIS Dave Minkel, National Geodetic Survey Michael Dennis, Geodetic Analysis, LLC Lex Newcomb, National Park Service
Presentation Outline • Describe a custom projection (i.e. low distortion projection) • Describe the project area and “issues” • Seven Steps for designing an LDP • Show the proposed GCNRA LDP • Show one of the biggest sins in custom projections • Reference Materials
Why bother with an LDP? • Provides standardized method for minimizing distortion over largest area possible • Distortion is not error ; it can not be removed entirely • Satisfies needs of both the surveying and GIS communities • Enables direct use of survey data in a GIS • …without resorting to “rubbersheeting” acts of desperation • Reduces proliferation of local systems • Provides alternative for those who want (or need) “ground” coordinates • Facilitates data transferability • Local data would be readily available to others (e.g. emergency services, Homeland Security)
Cartoon: Distortion due to change in ellipsoidal height (1 of 2)
Cartoon: Distortion due to change in ellipsoidal height (2 of 2)
What’s Different from Days of Yore? • Computing “power” has become awesome • GIS software – reprojection-on-the-fly • The National Spatial Reference System is an LDP “enabler” • Accurate to a few centimeters • Economically available ANYWHERE • OPUS, CORS, Survey Monuments • Assures temporal consistency • High accuracy GIS data are commonplace • GNSS, LIDAR, & other technologies
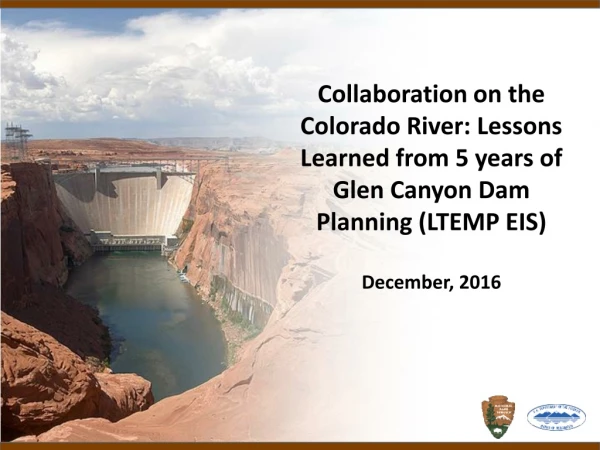
GCNRA Factoids • ≈1960 sq mi • Elevation • Average is 4,500 ft • Lake is at 3,700 ft • Most facilities are near lake • NGS & NPS are establishing network control • GCNRA activities • Tourist facilities • Park infrastructure • Mineral leases • Anthropological sites • Environmental monitoring • Facilities work done by contactors • GCNRA GIS dept. is 1 person
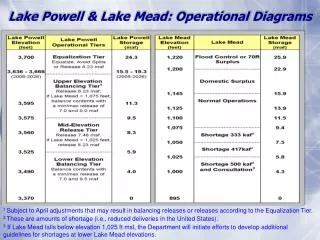
So, How Bad is it up there? UTM is even worse!!
Seven steps for designing a low-distortion grid coordinate system • Define project area and select appropriate projection (Lambert CC, TM, or Oblique Mercator) • Place Central Meridian near center of project area • Choose representative ellipsoid height, ho (not elevation) • The average height of an area may not be appropriate • Compute central meridian scale as: • Where R is Earth radius • This is for Transverse Mercator projection; for Lambert Conical projection, use same approach to compute scale for standard parallel
Seven steps for designing a low-distortion grid coordinate system • Check distortion throughout project area • Best approach: Compute distortion over entire area, generate distortion contours, and refine ko • Compute distortion as: • Multiplyδby 1,000,000 to get distortion in ppm • Keep definition simple and clean • Define ko to no more than SIX decimal places • Geodetic origins to nearest arc-minute • Grid origins using whole numbers, small as possible • Set so Easting and Northing do NOT share similar ranges • Explicitly define linear unit and geodetic datum Combined Scale Factor
Using ArcGIS to define an LDP • To Generate/Contour distortion(s) • Use Excel, or dedicated program(s), to compute gridded data set of distortions for input to ArcGIS for contouring • Use Geodetic Analyst plug-in to generate distortion contour plots • Used by authors for this projection • Iterate steps 3 through 5 (previous slides) until suitable projection is defined • alter other parameters if needed
Proposed GCNRA LDP *Suggested realization for data is NAD83 (NSRS2007)
Modified SPC(“scaling SP to ground”) Friends don’t let Friends modify State Plane Projections
Reference Materials • WWW.AZHMP.ORG – Presentations & Papers Tab • This presentation and other materials • Geodetic Analyst plug-in – • mld@geodeticanalysis.com • NGS RTK Guidelines – Appendix E • http://www.ngs.noaa.gov/PUBS_LIB/NGSRealTimeUserGuidelines.v1.0.pdf • Oregon DOT • http://www.state.or.us/ODOT/HWY/GEOMETRONICS/ocrs.shtml