Download
1 / 49

E N D
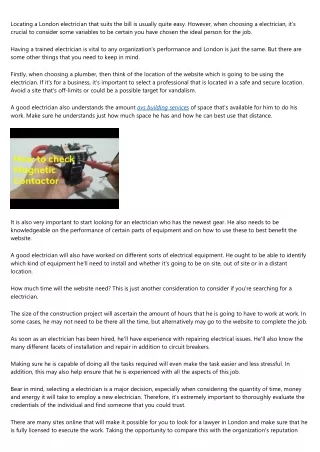
4.55 Mean 3.52 Mean Print increases revenue but TV is superior Other media did not show long-term revenue growth. Could be: poor investments, data variation, mostly short-term 5.9* 4.88* 3.19** 2.16** Increase in revenue (£m) for a £1m advertising investment * = + standard error, ** = -1 standard error
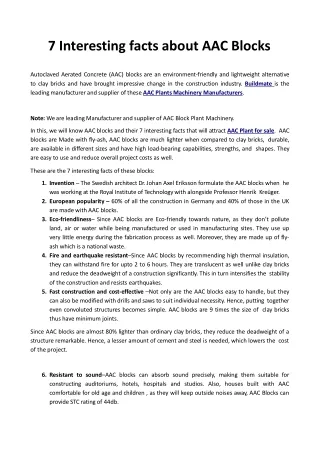
…and TV ads deliver growth for longer Revenue effect as % of year 1 effect Year 1 TV investment still affecting sales in year 2 almost as strongly
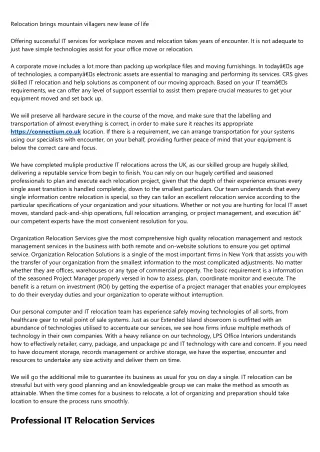
TV is the most effective generator of brand value TV investment more strongly associated with current brand values than any other medium Perfect Correlation = 1 Average correlation, 7 categories 2008 WTP to 2007-2008 media spend No Correlation (0) Internet not included because brand level data unavailable
TV is core for nearly all leading brand value owners £m … and used more than twice the sector average of our survey by all the market leaders
The IPA found that TV builds market share better Campaigns that used TV were more efficient at driving market share in relation to share of voice Market share% points gain per 10% points excess SOV
TV is becoming more effective over time The launch of multi-channel is making it easier to reach consumers
2.TV hardwires brand memories
TV is effective; it’s a scientific fact Neuroscience shows TV’s effect on emotion & long-term memory ie where brands live The power of audio-visual and human gesture = deep emotional response The context of viewing – relaxed and shared
Emotional ads provoke the implicit mind The Explicit/ Conscious/ Rational Mind Conscious mind - conscious analysis and rejection? The Implicit/ Emotional Mind Constantly informs us via gut feelings and intuitions. Guides behaviour without conscious analysis
Thinkbox’s sponsorship work showed that… …the implicit mind is highly associative. Meaningful, emotional associations stored beneath the cognitive radar. Sponsors become firmly associated with programme This results in the programme personality ‘rubbing off’ on the brand The words used to describe the brand & programme were more closely aligned by fans of the programme than non-viewers
Ad liking is the key to driving brand KPIs Thinkbox’s Engagement study showed that the standard KPIs of recall and attribution had no correlation with brand favourability or purchase intent Recognition 0.74 ‘Liking’ Relevance 0.84 Awareness Creativity Ad KPIs Brand KPIs 0.48 0.42 Favourability Usage Future Purchase Intention
Commercial TV viewing continues to grow average hours per day Source: BARB/TechEdge
Consistent increase in commercial impacts +15% billions +17.3% +19.1% +6.2% +8.8% Source: BARB/DDS
IPA Touchpoints2: TV dominates the media day The IPA’s Touchpoints2 survey shows that TV is the dominant medium, accounting for 54% of media time each day Source: Touchpoints2 2008 – Adults. Base: All Media use per day
TV fares even better within just ad-supported media Commercial only Source: Touchpoints2 2008 – Adults Base: All commercial Media use per day (exc BBC TV, BBC radio and internet email time)
Our media time in 2008 differed little from 2005 How we spend our media time hasn’t changed much since 2005 – only TV and the internet have increased 2008 (hrs) 3.90 2.09 1.30 0.59 0.23 2005 (hrs) 3.83 2.18 1.19 0.59 0.27 4.2 minutes 5.4 minutes 6.6 minutes No change 2.4 minutes Source: Touchpoints 2005 and 2008 - Adults
TV is under-valued comparing ad spend to time spent % Source: Touchpoints 2008 and Advertising Statistics Yearbook 2008 Base: time and revenue calculated as a % of total internet, press, radio and TV only * Cinema, OOH and DM time not available
4.TV is the dominant youth medium
TV is by far the dominant medium for 15-24s Source: Touchpoints 2008 – 15-24s Base: All Media use per day
…and 15-24s’ TV viewing has increased since TP1 2008 (hrs) 3.37 1.70 1.55 0.25 0.40 2005 (hrs) 2.92 1.77 1.25 0.27 0.20 Source: Touchpoints 2005 and 2008 – 15-24s
BARB also shows 16-34 increase to commercial TV +24 mins average hours per week Source: BARB/TechEdge
TV and music: favourite activities for young people Sample =
TV plays key roles in young peoples’ lives Glamour & Entertainment Stature & Legitimacy Reaching out Emotional Central Heating Social Currency Inner life Reaching out Inner life Sample =
TV stimulates their conversations Overall TV content has a greater capacity for encouraging peer group discussion and debate than other forms of electronic media and entertainment Base: All respondents aged 13+ Please choose the one thing you talk about most with your friends?
Young people are less ad averse Young people are almost 3 times more likely to enjoy TV ads than adults and generally accept advertising as part of commercial TV Out of all adverts mentions almost 80% were from TV Source: Other lines/TGI
Young people are less ad averse Young people are almost 3 times more likely to enjoy TV ads than adults and generally accept advertising as part of commercial TV Out of all adverts mentions almost 80% were from TV Source: Other lines/TGI
DTR owners watch more telly and more ads Digital TV Recorders are now in c. 30% of UK homes*: 4.65m homes subscribe to Sky+ - that’s half of all Sky homes Sales of Freeview DTRs have rocketed to 2.3m in total 522k households subscribe to V+ from Virgin 398k homes have a BT Vision DTR** 14k opt for the Tiscali + package** Around 28% of all DTT set-top boxes sold in the final quarter of 2008 contained DTR capabilities – that’s more than 2 boxes sold every minute According to the Parks Associates study ‘Entertainment 2.0 in Europe’ (Dec 08), over a third of UK broadband homes own a DTR – making us the most DTR-advanced country in Europe Freeview+ figures = Freeview, Jan 2009. *Total penetration is an estimate based on the assumption that most Freeview+ boxes will be connected to main, rather than secondary sets. **Screen Digest figures
…and recall ads even when fast forwarded According to Duckfoot Research, even when ads are fast forwarded at 30X speed, recall is still around 2/3rds of the level when viewed at normal speed if ad already seen However this is all free value to advertisers as BARB does not count anything fast-forwarded as an impact
‘Disruptive’ technologies nurture TV… ‘Disruptive’ technologies nurture the medium Death of the 30” spot A Love Story Schedule builder End of the schedule TV’s informal PR machine Eating into broadcast
64% of people have watched some web TV* Internet/Broadband TV Closed System Open System IPTV Web TV Simulcasts, streaming, downloads ( temporary & to own) Linear and on-demand to TV screens Broadcaster Services Other Aggregators Retailer Sites Hosted On-demand services from broadcasters also available via IPTV platforms *Source = Me-TV/Work Research November 2008
Recency of viewing is increasing - fast In just 4 months, frequency of use amongst respondents rose considerably Reach
Broadcasters are now major players in Web TV Reach The high reach of broadcaster TV web services is driven by: Quality content Legality Safety Familiarity Trusted aggregators
Broadband and WIFI are liberating usage Home use has increased significantly (laptops & WIFI). TV moving out of the home – taking TV to new domains such as work & travel.
Catching up is main motivation for all TV 78% in Catch-up segment 22% in Discovery segment
6. TV is the new Point of Sale medium
TV starting the journey to online search/purchase Signed up to the deal Awareness and URL Further information Purchased product Find product Compare prices Inspires purchase Bought the car Engaging TV advert Explore spec Purchased product Searched for new mascara product on programme’s website Sparked an idea for a gift
TV ads work best at the start of the consumer journey Net difference (% points) Online ads % Agree TV ads Tells you about a new brand you’ve never heard of before +6% +16% Sparks interest in a brand Gives you new information about a brand you have heard of +14% +16% Persuades you to try a brand/product +23% Talked about with someone else Helps you decide which brands are relevant to you +7% Makes you re-evaluate a brand +9% Gives you enough information to make purchase decision +5% +13% Makes you like a brand Base : All adults (3,011 weighted); Q36a/b
TV & online ads can trigger purchase Online ads % agree they have responded to ads in this way TV ads Net difference (% points) +22% Looked in shop for brand +19% Remembered brand when considering buying +13% Visited brand’s website to find out more +18% Talked to someone about brand +9% Used comparison/review site +9% Searched net for where to buy brand +7% Bought brand online +4% Immediately searched net for more information +2% Searched for competitors +0% Blogs and forums to discuss
TV and internet together enables instant response This is second only to eating, for activities whilst TV is on Half of digitally advanced group now use together daily At least once a day No More online chat, music, games, sports: relaxed usage Internet usage is genuinely during TV programmes Less often At least once a week “I sit with it (laptop) on my knee, all night sometimes… watching TV and messing around online” (Pre-family male) Base : All adults (3,011 weighted) Q5 / Those using both together (1,934 weighted) Q6a
7. TV is the most talked about medium
TV is the 3rd most talked about subject Which of these things you talk about with other people? Source TOM Q1 Base: UK adults aged 16+ Jan – Dec 2008 (2,426)
70% shared viewing promotes conversations Source: Holden Pearmain Quant Study 2007
Online catches and extends the talk about TV Susan Boyle: over 11 million viewers on ITV1 on 11th April 2009 and since by over 150 million people worldwide TV programme fan-groups are big online eg X-factor group= 200,000+ and Skins group = 550,000+ Numerous TV ad-related groups on Facebook eg Alexandr the meerkat has 350,000 Facebook fans Online conversations (eg Twitter, MSN) encourage live TV viewing
1. TV is the best profit generator 2. TV hardwires brand memories 3. We watch 1 hour more commercial TV every week 4. TV is the dominant youth medium 5. TV technologies are good news for TV 6. TV is the point of sale medium 7. TV is the most talked about medium