Download

1 / 22
220 likes | 231 Views
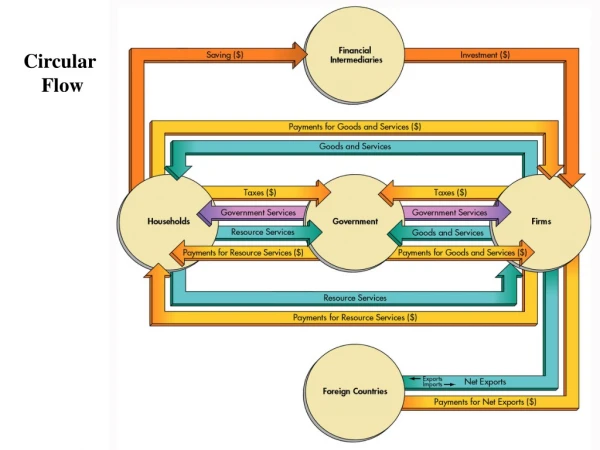
FIGURE 11.1 GDP and the Circular Flow. TABLE 11.1 Nominal Versus Real GDP. FIGURE 11.2 U.S. Nominal vs. Real GDP(2005 =100). FIGURE 11.3A 2010 Nominal Gross Domestic Product (GDP) for Selected Countries.

E N D
FIGURE 11.3A 2010 Nominal Gross Domestic Product (GDP) for Selected Countries
FIGURE 11.3B 2010 Nominal Gross Domestic Product (GDP) per Capita for Selected Countries
TABLE 11.2 Gross Domestic Product and Its Components,2011 Expenditure or Output Measurement
FIGURE 11.5 Real GDP Growth—2000 to 2012.1 (annual growth rates in percent)
FIGURE 11.6 Average Growth of Real GDP Components—2000 to 2012.1 (annual growth rates in percent)
TABLE 11.3 Gross Domestic Product and Its Components, 2011 Earnings or Income Measurement
FIGURE 11.7 Annual Percentage Change in the GDP Deflator (ratio of current $ to chained 2005 $ = 100)
TABLE 11.4 Price Deflators for GDP and Its Components, 2005–2011
FIGURE 11.8 Trends in Consumer Inflation Rates (annual percentage changes of monthly data using the CPI)
TABLE 11.5 Percent Change in Expenditure Category,May 2011–May 2012 (Unadjusted)
FIGURE 11.9 Trends in Wholesale Inflation Rates (annual percent changes of monthly data using the PPI)