Download
1 / 6
60 likes | 217 Views
Isolectin B4 Iba1. Isolectin B4 Iba1. OPL. OPL. OPL. GCL. GCL. GCL. H&E. Normal. Diabetic. Figure S1.

E N D
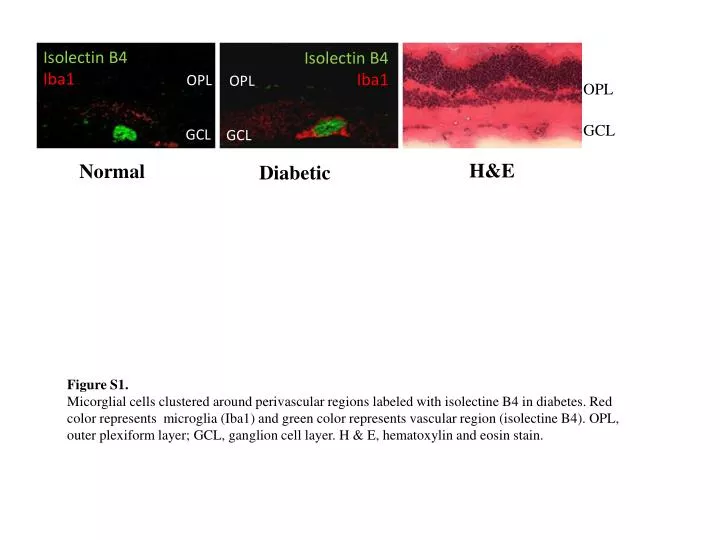
Isolectin B4 Iba1 Isolectin B4 Iba1 OPL OPL OPL GCL GCL GCL H&E Normal Diabetic Figure S1. Micorglial cells clustered around perivascular regions labeled with isolectine B4 in diabetes. Red color represents microglia (Iba1) and green color represents vascular region (isolectine B4). OPL, outer plexiform layer; GCL, ganglion cell layer. H & E, hematoxylin and eosin stain.
A. Normal B. Diabetic OPL C. D. GCL Iba1 Iba1 Figure S2. Microglia in the retina become activated during diabetes. Retinas from control and diabetic rats were processed for Iba-1 (red) 8 weeks after diabetes was induced. Microglia in the control retinas possessed thin processes characteristic of ramified microglia (A and C), while in the retinas of diabetic rats appeared hypertrophic indicative of an activated phenotype (B and D). C and D represent fivefold enlargements of sections of A and B.
TUNEL PI MergeBright field A B Figure S3. Apoptosis in microglia cells after activation with AGA 500 ug/ml. A) TUNEL-positive control obtained by using nuclease and apoptosis signals were observed in almost all nuclei. B) Microglial cells treated with AGA for 4 hours and no apoptosis signal was observed. Red images represent nuclear staining (PI; Propedium iodide) and green images represent positive TUNEL staining.
p< 0.001 p< 0.001 TNF-α Produced,% ofControl - µM SB202190 0 1 10 20 AGA - + + + + Normal Control Figure S4A. Dose-dependent inhibition of AGA-induced TNF-α release in retinal microglial cells by inhibitor for P38(SB202190). Cells were treated with 500 μg/mL of AGA for 4 h in the presence of indicated concentrations of the inhibitor. TNF-α levels were compared to the vehicle-treated control. Data shown are the mean + SD of three experiments.
Cell viability (%) µM SB202190 Figure S4B. Effect of SB202190 on cell viability, as determined by trypan blue exclusion test.
P<0.001 N.S Figure 4SC. P38 inhibitors do not affect the ROS generation. Retinal microglial cells loaded with 2′,7′-dichlorodihydrofluorescein diacetate were pre-treated with P38 inhibitors or DMSO, then treated with AGA, and the fluorescence of DCF was measured at 15 min. ROS formation was expressed as changes in DCF fluorescence/mg protein. Data shown are the mean + SD of 3 experiments.